

Virtual Gallery: Tongariro National Park
Context and Data
I present a virtual gallery showcasing the Tongariro National Park, and the landscapes of the Manawatū-Whanganui Region of New Zealand. Located in the middle of the North Island or Te Ika-a-Māui, the region contains prominent volcanic features and numerous geological and geomorphological features that make for interesting and striking landscape visualisations.
The purpose of this gallery came from a desire to use colours I wouldn’t normally use, continue to develop my skills, and have some fun. It has been an enjoyable opportunity to further explore and create.
Tongariro National Park
Culturally, it is sacred to Ngāti Tūwharetoa. It was gifted to the Crown by chief Te Heuheu Tūkino IV to protect the maunga, establishing a precedent for conservation rooted in values of kaitiakitanga.
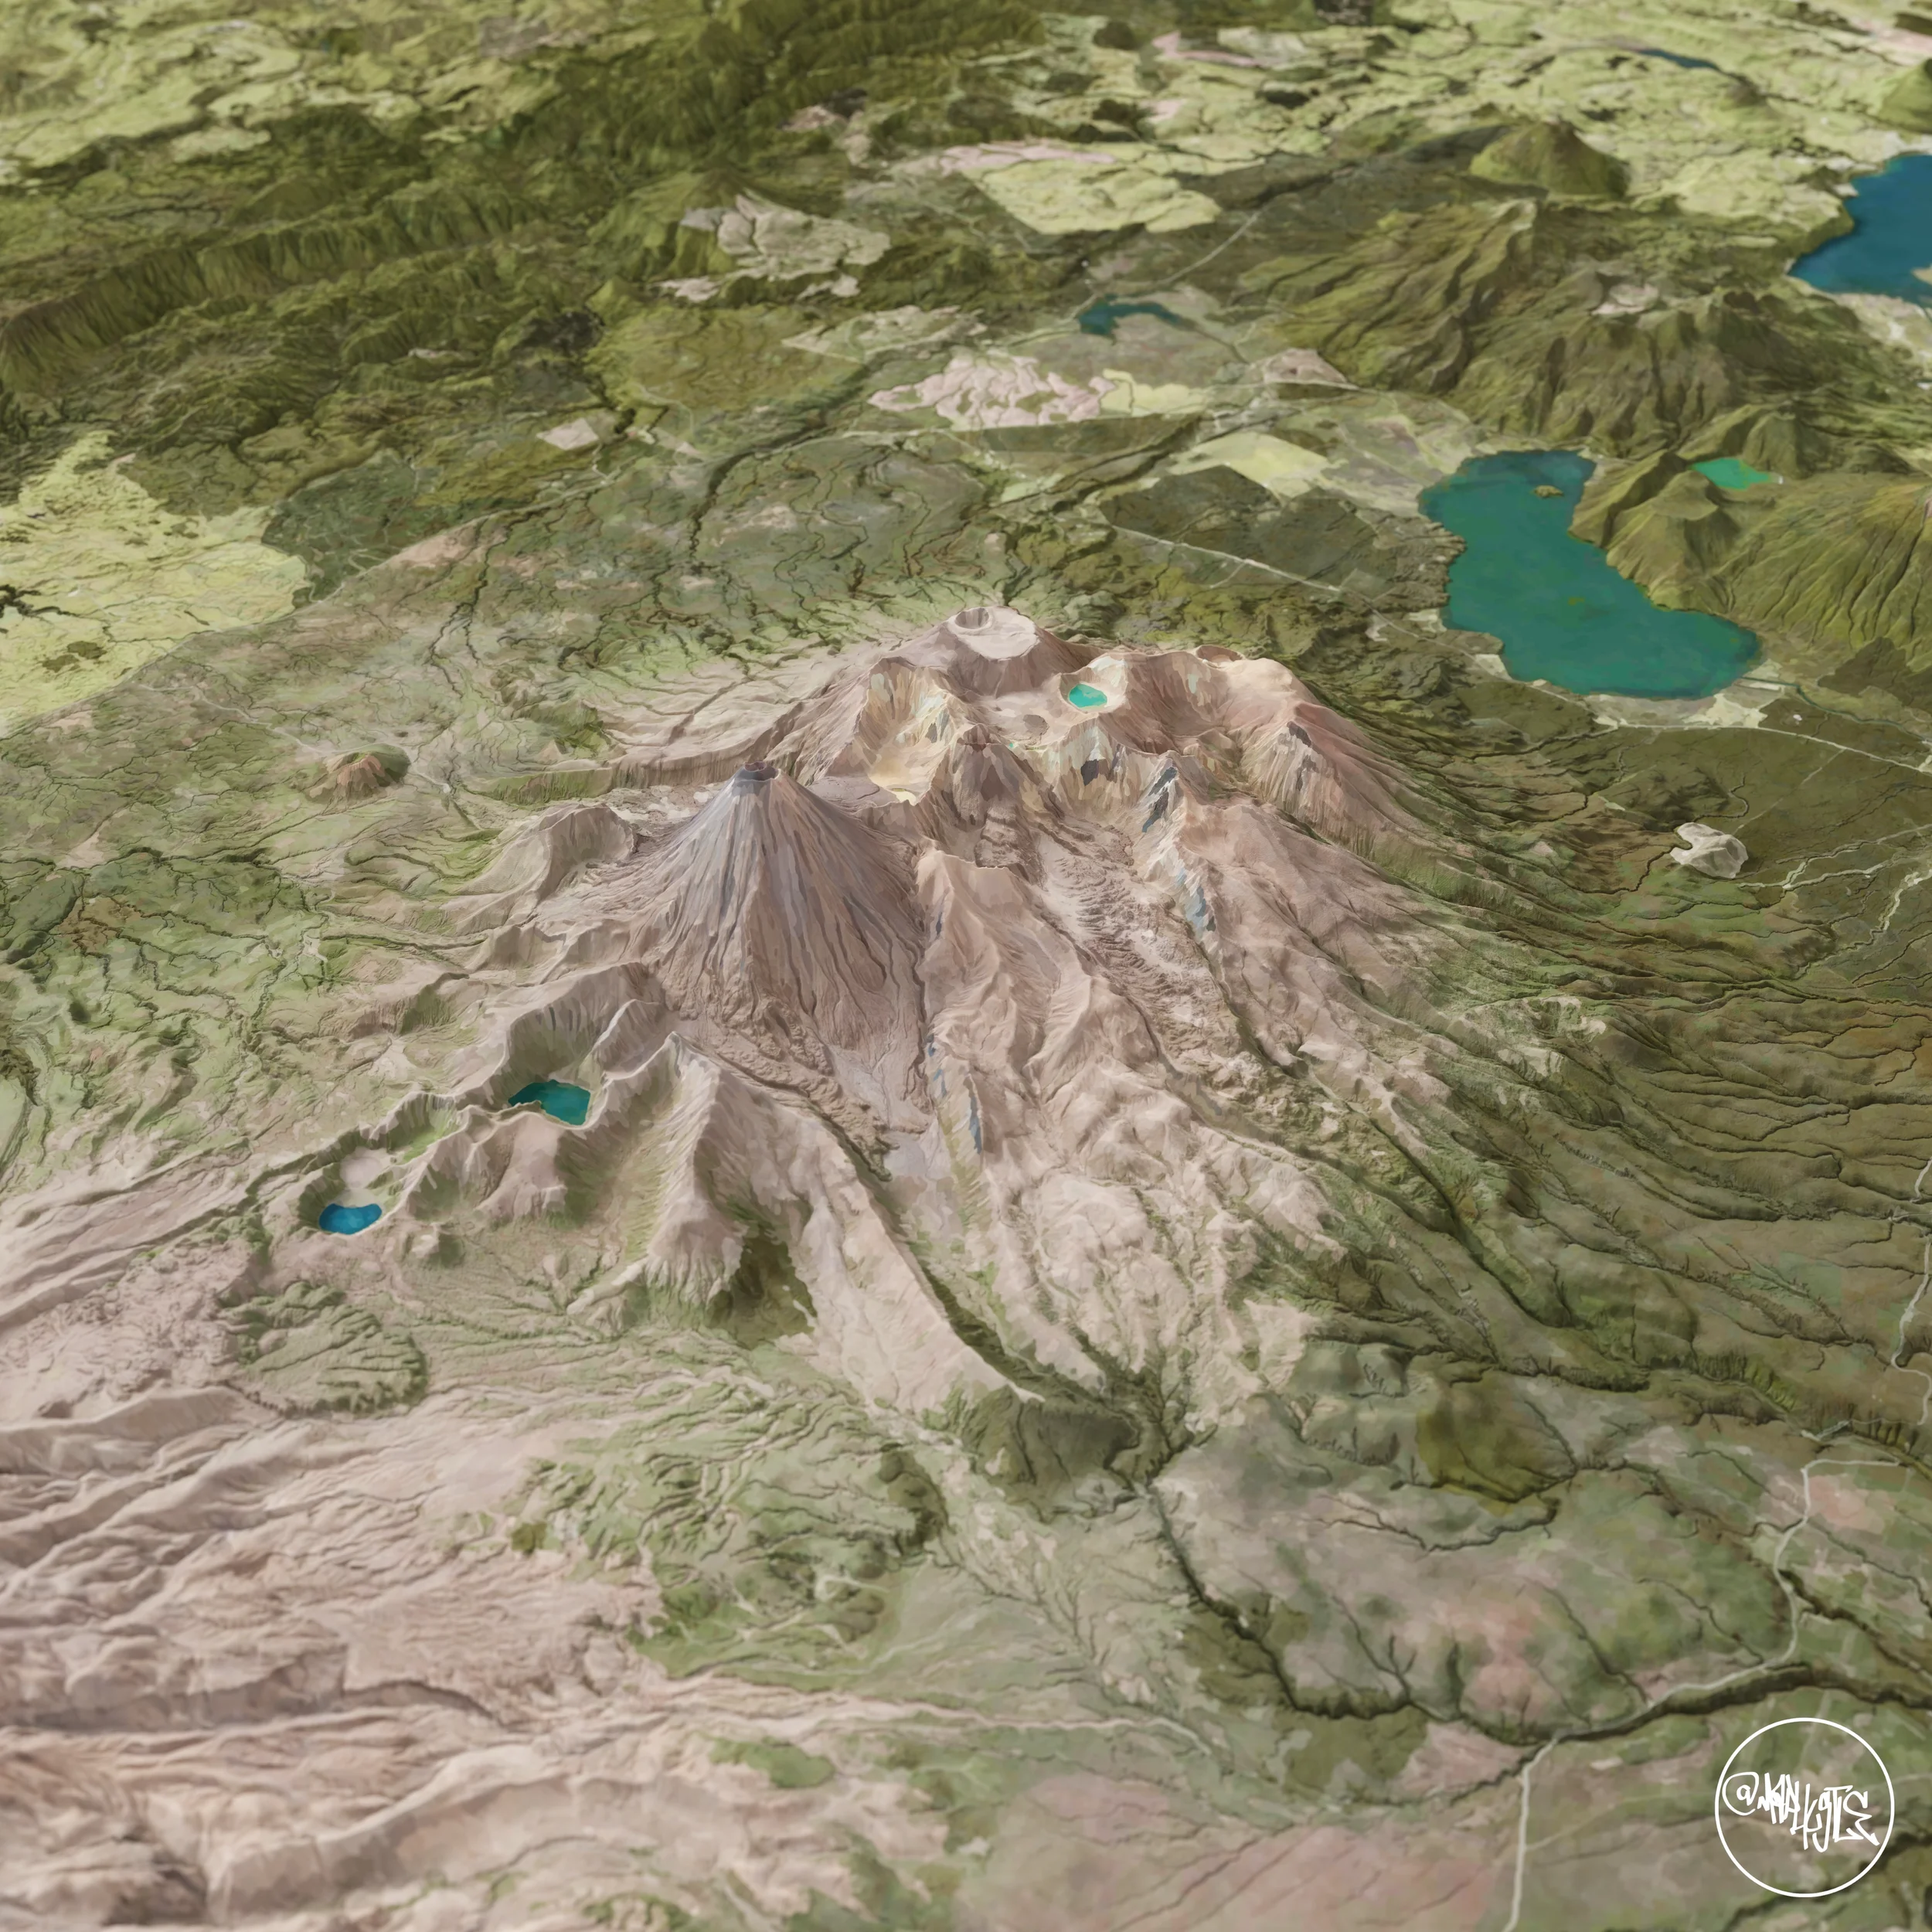
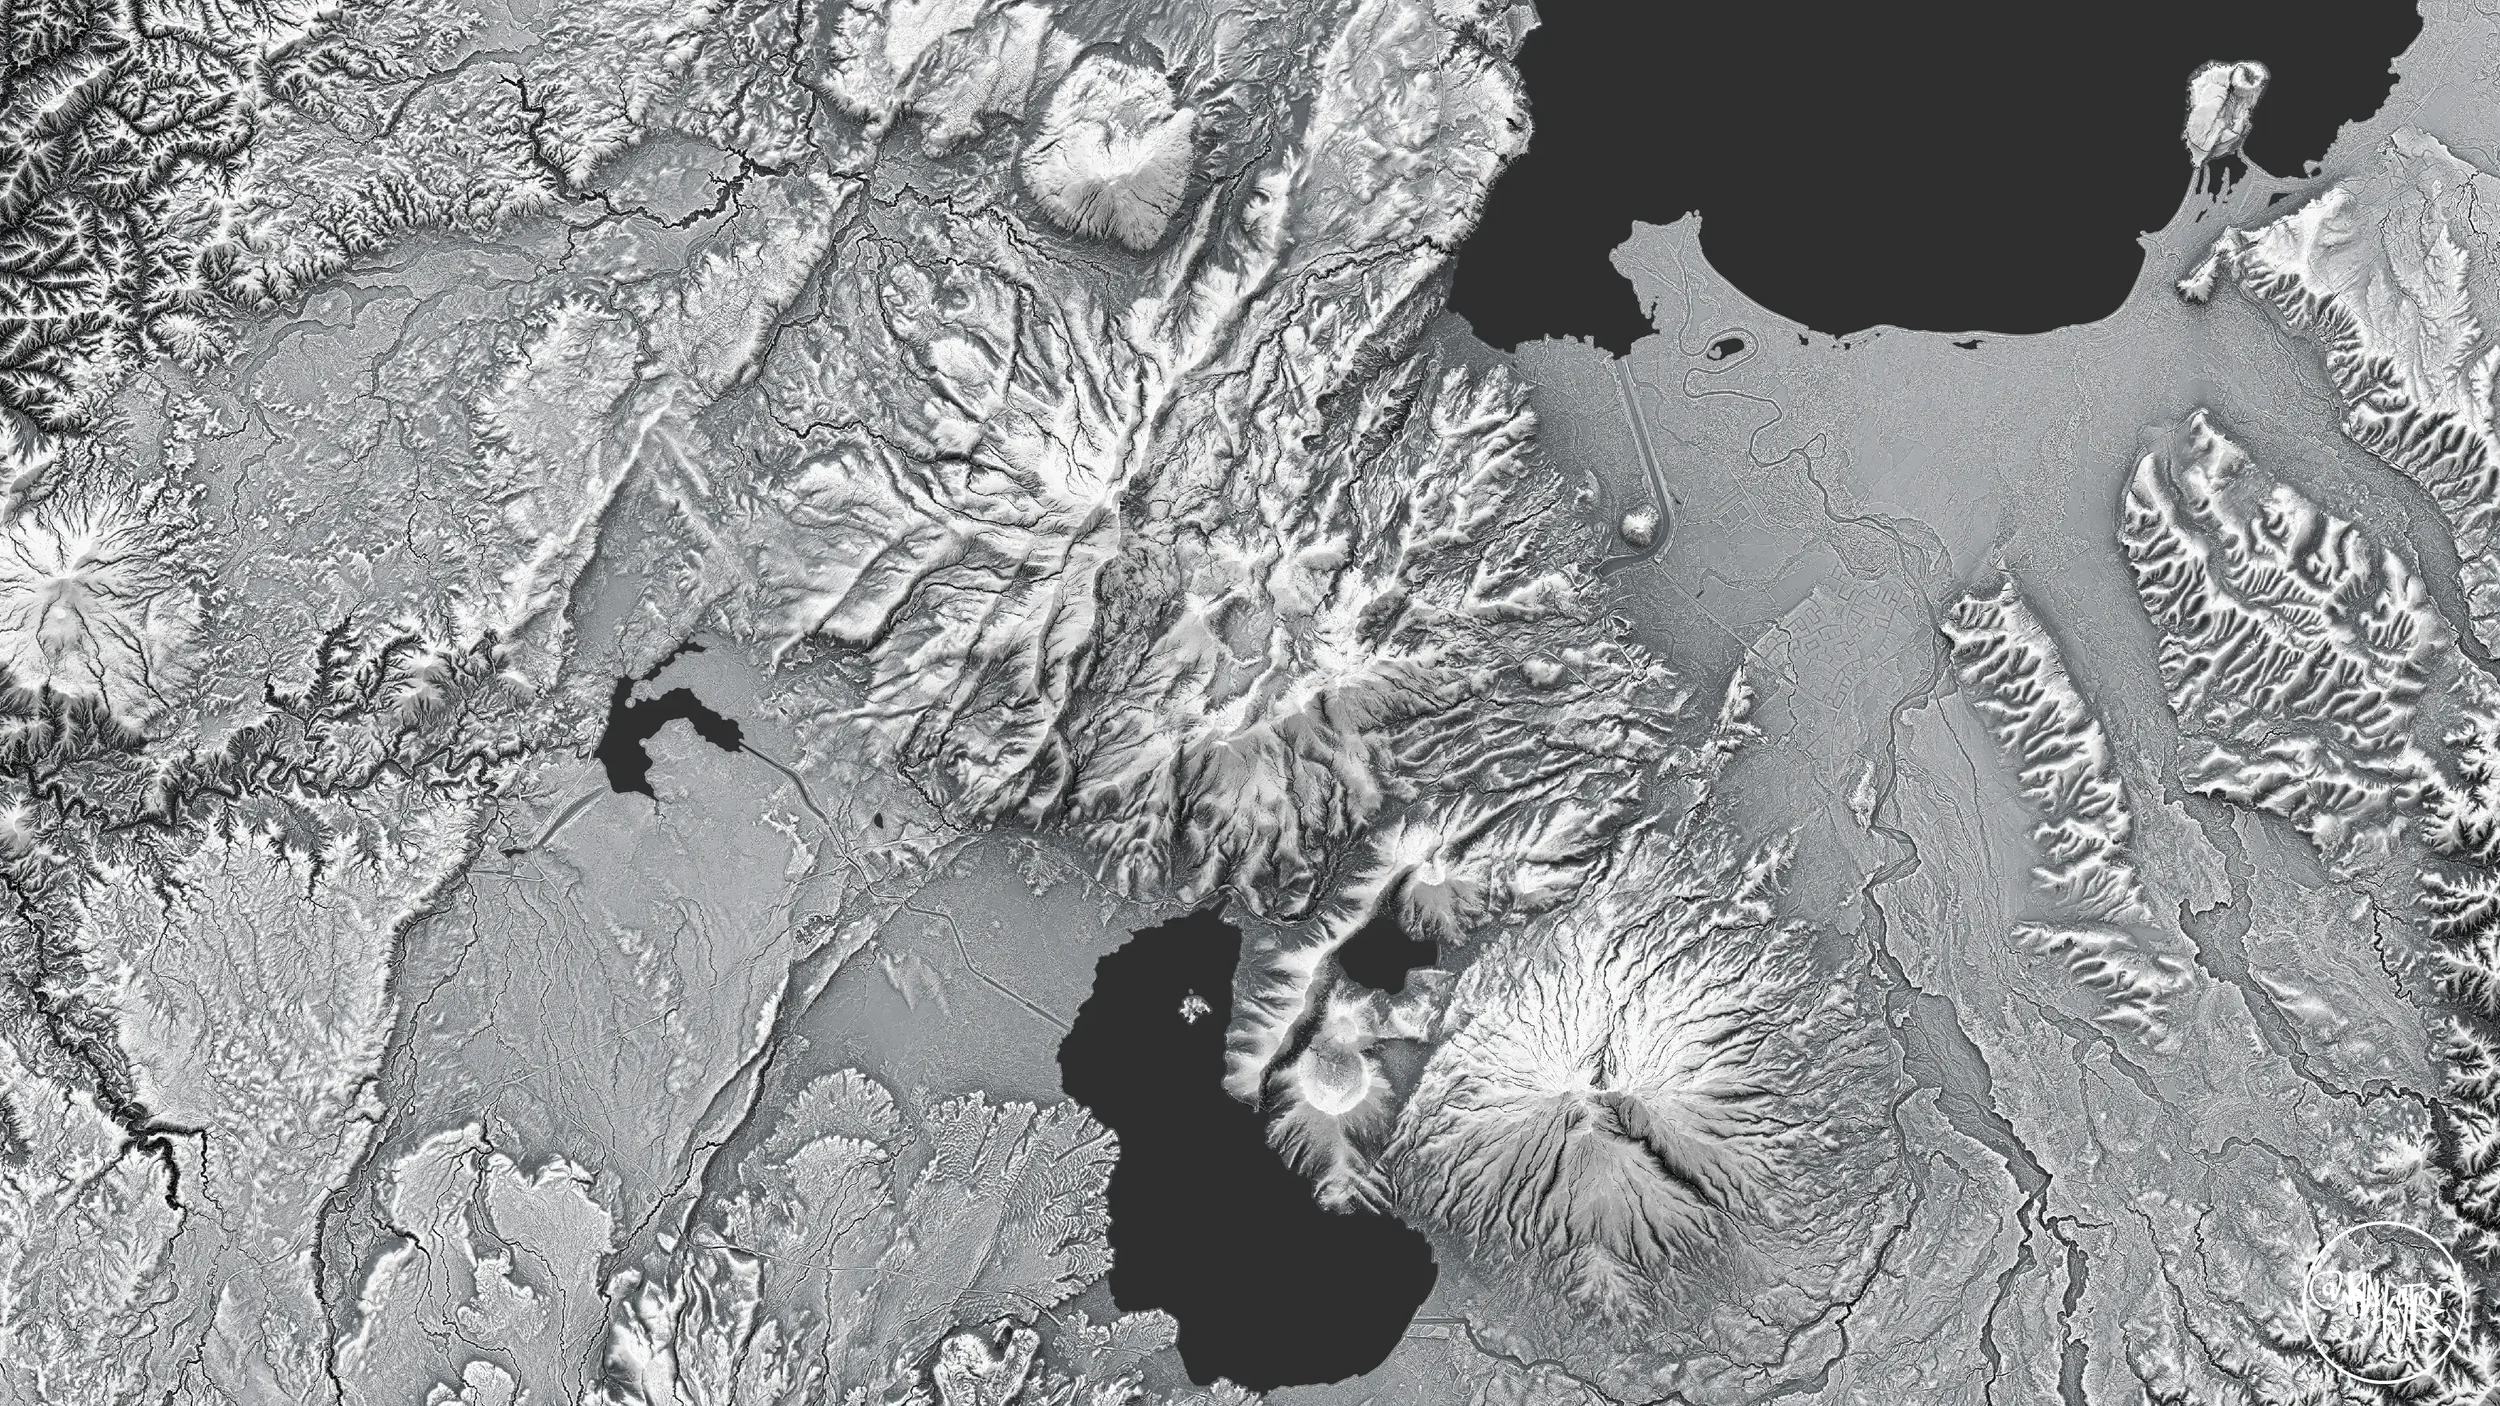
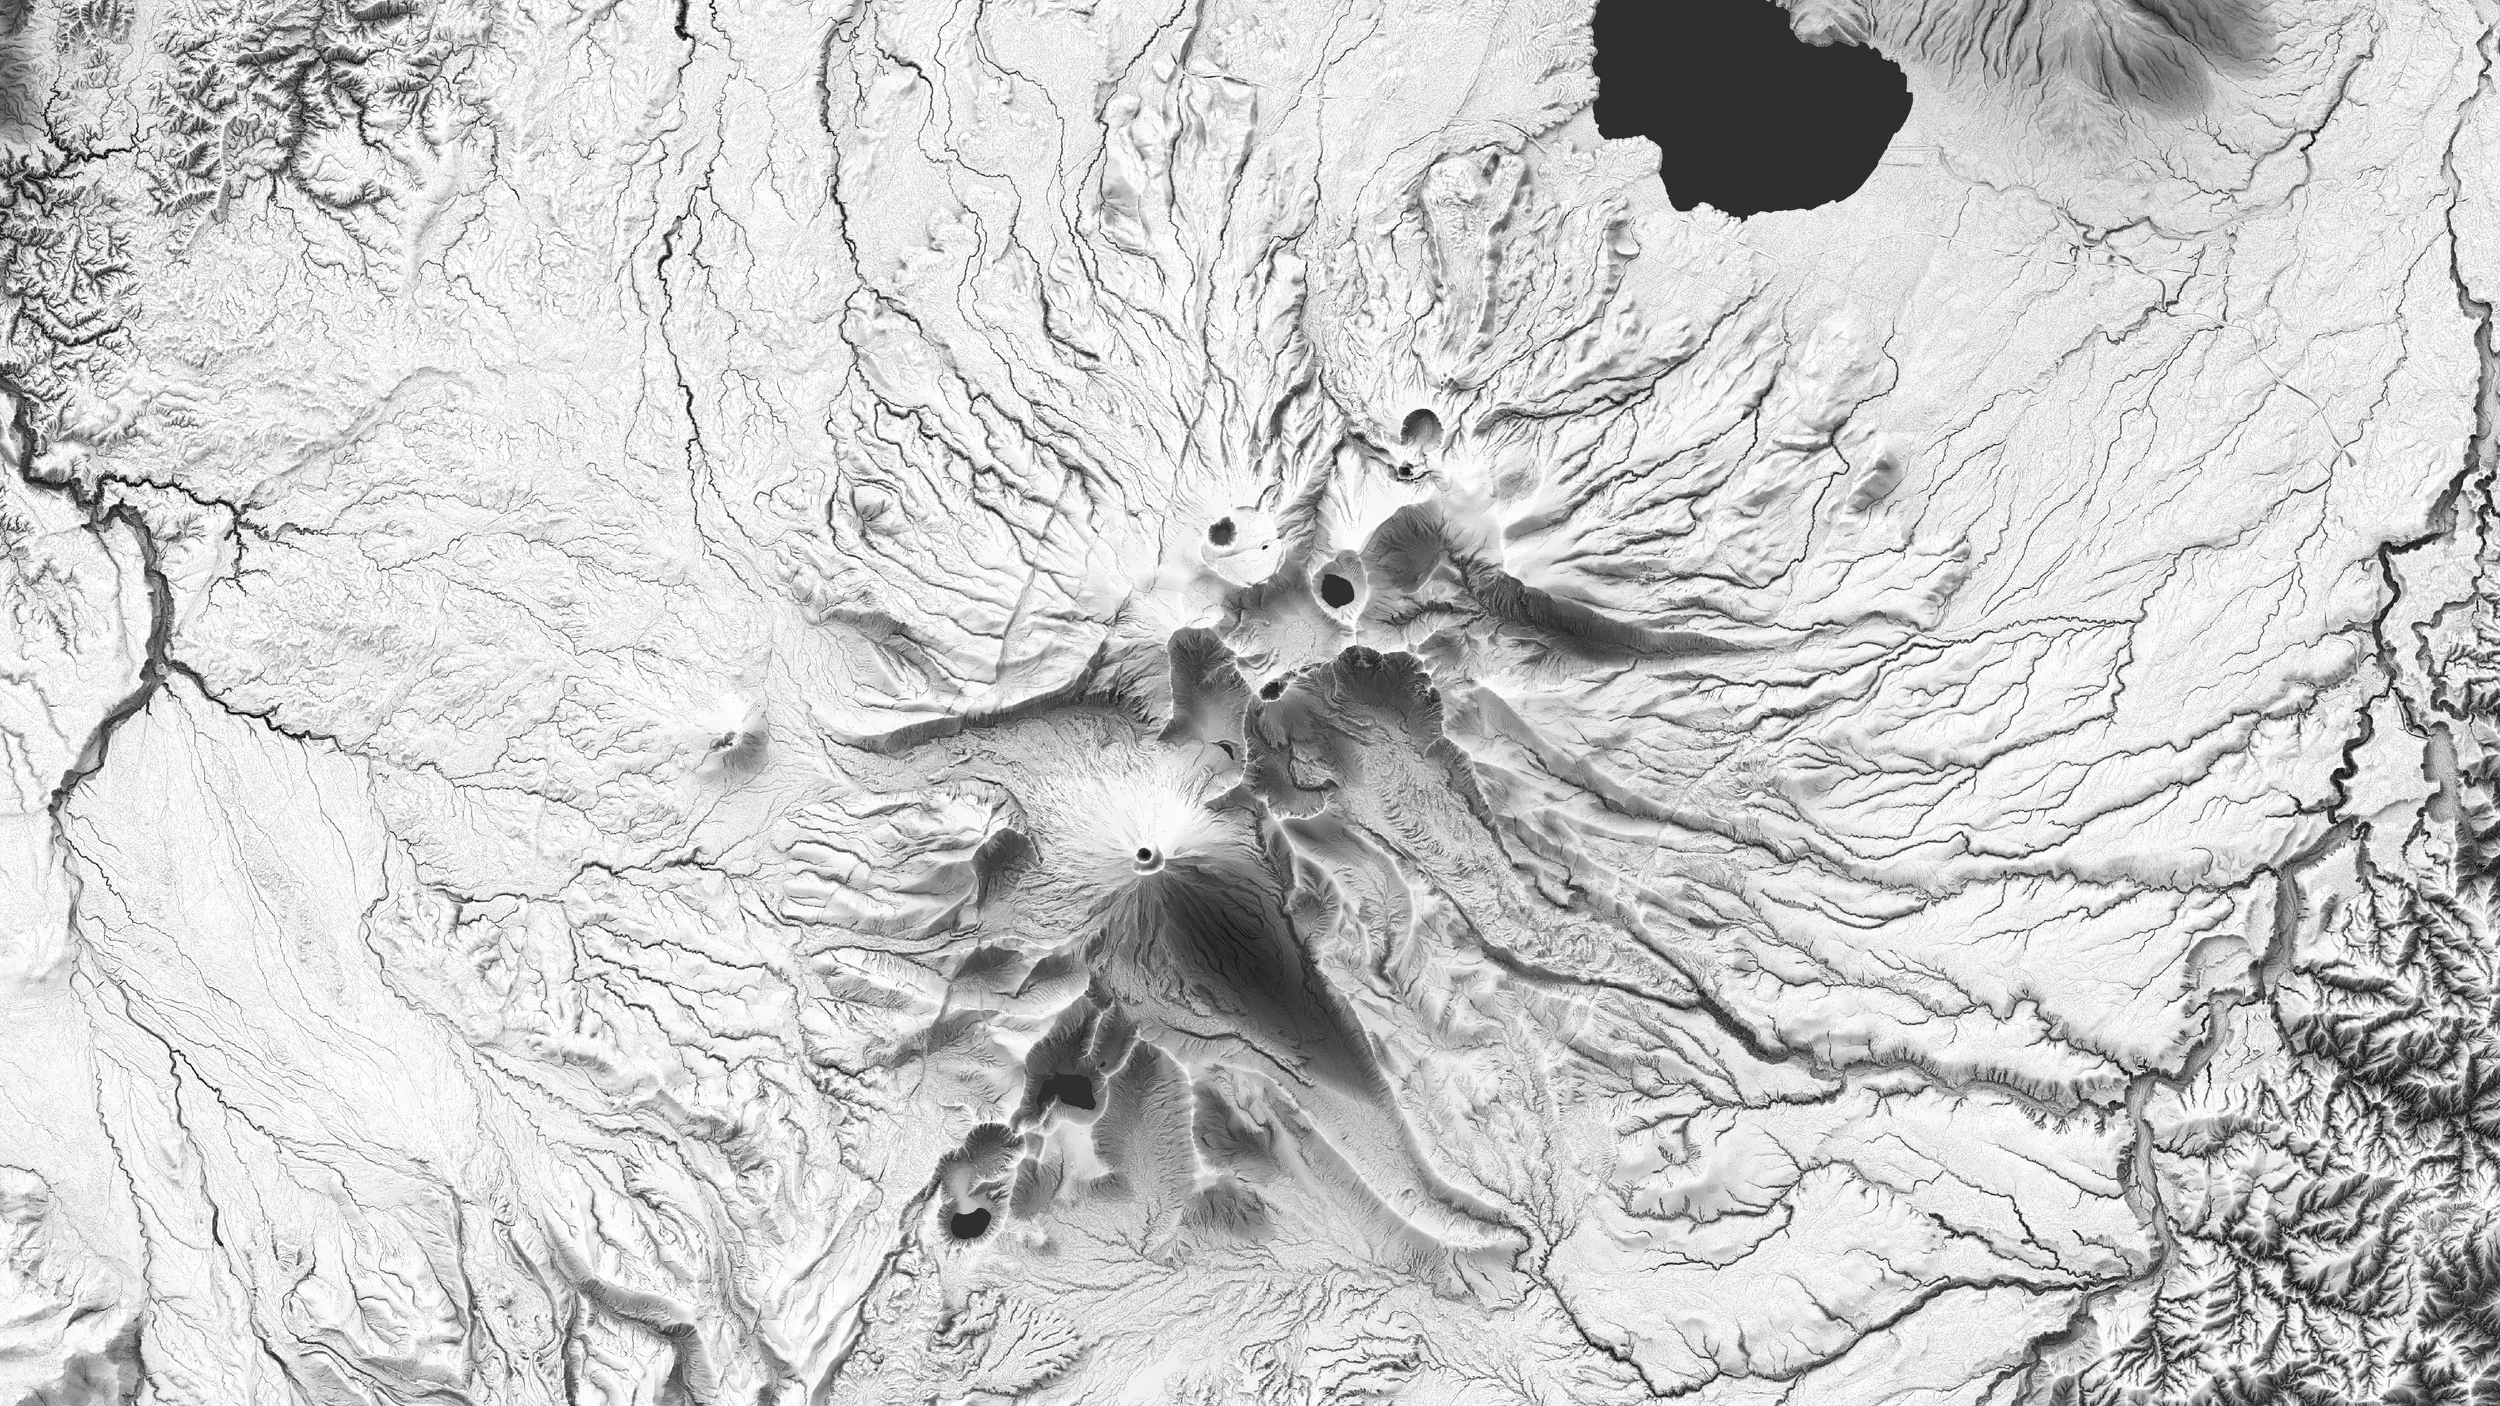
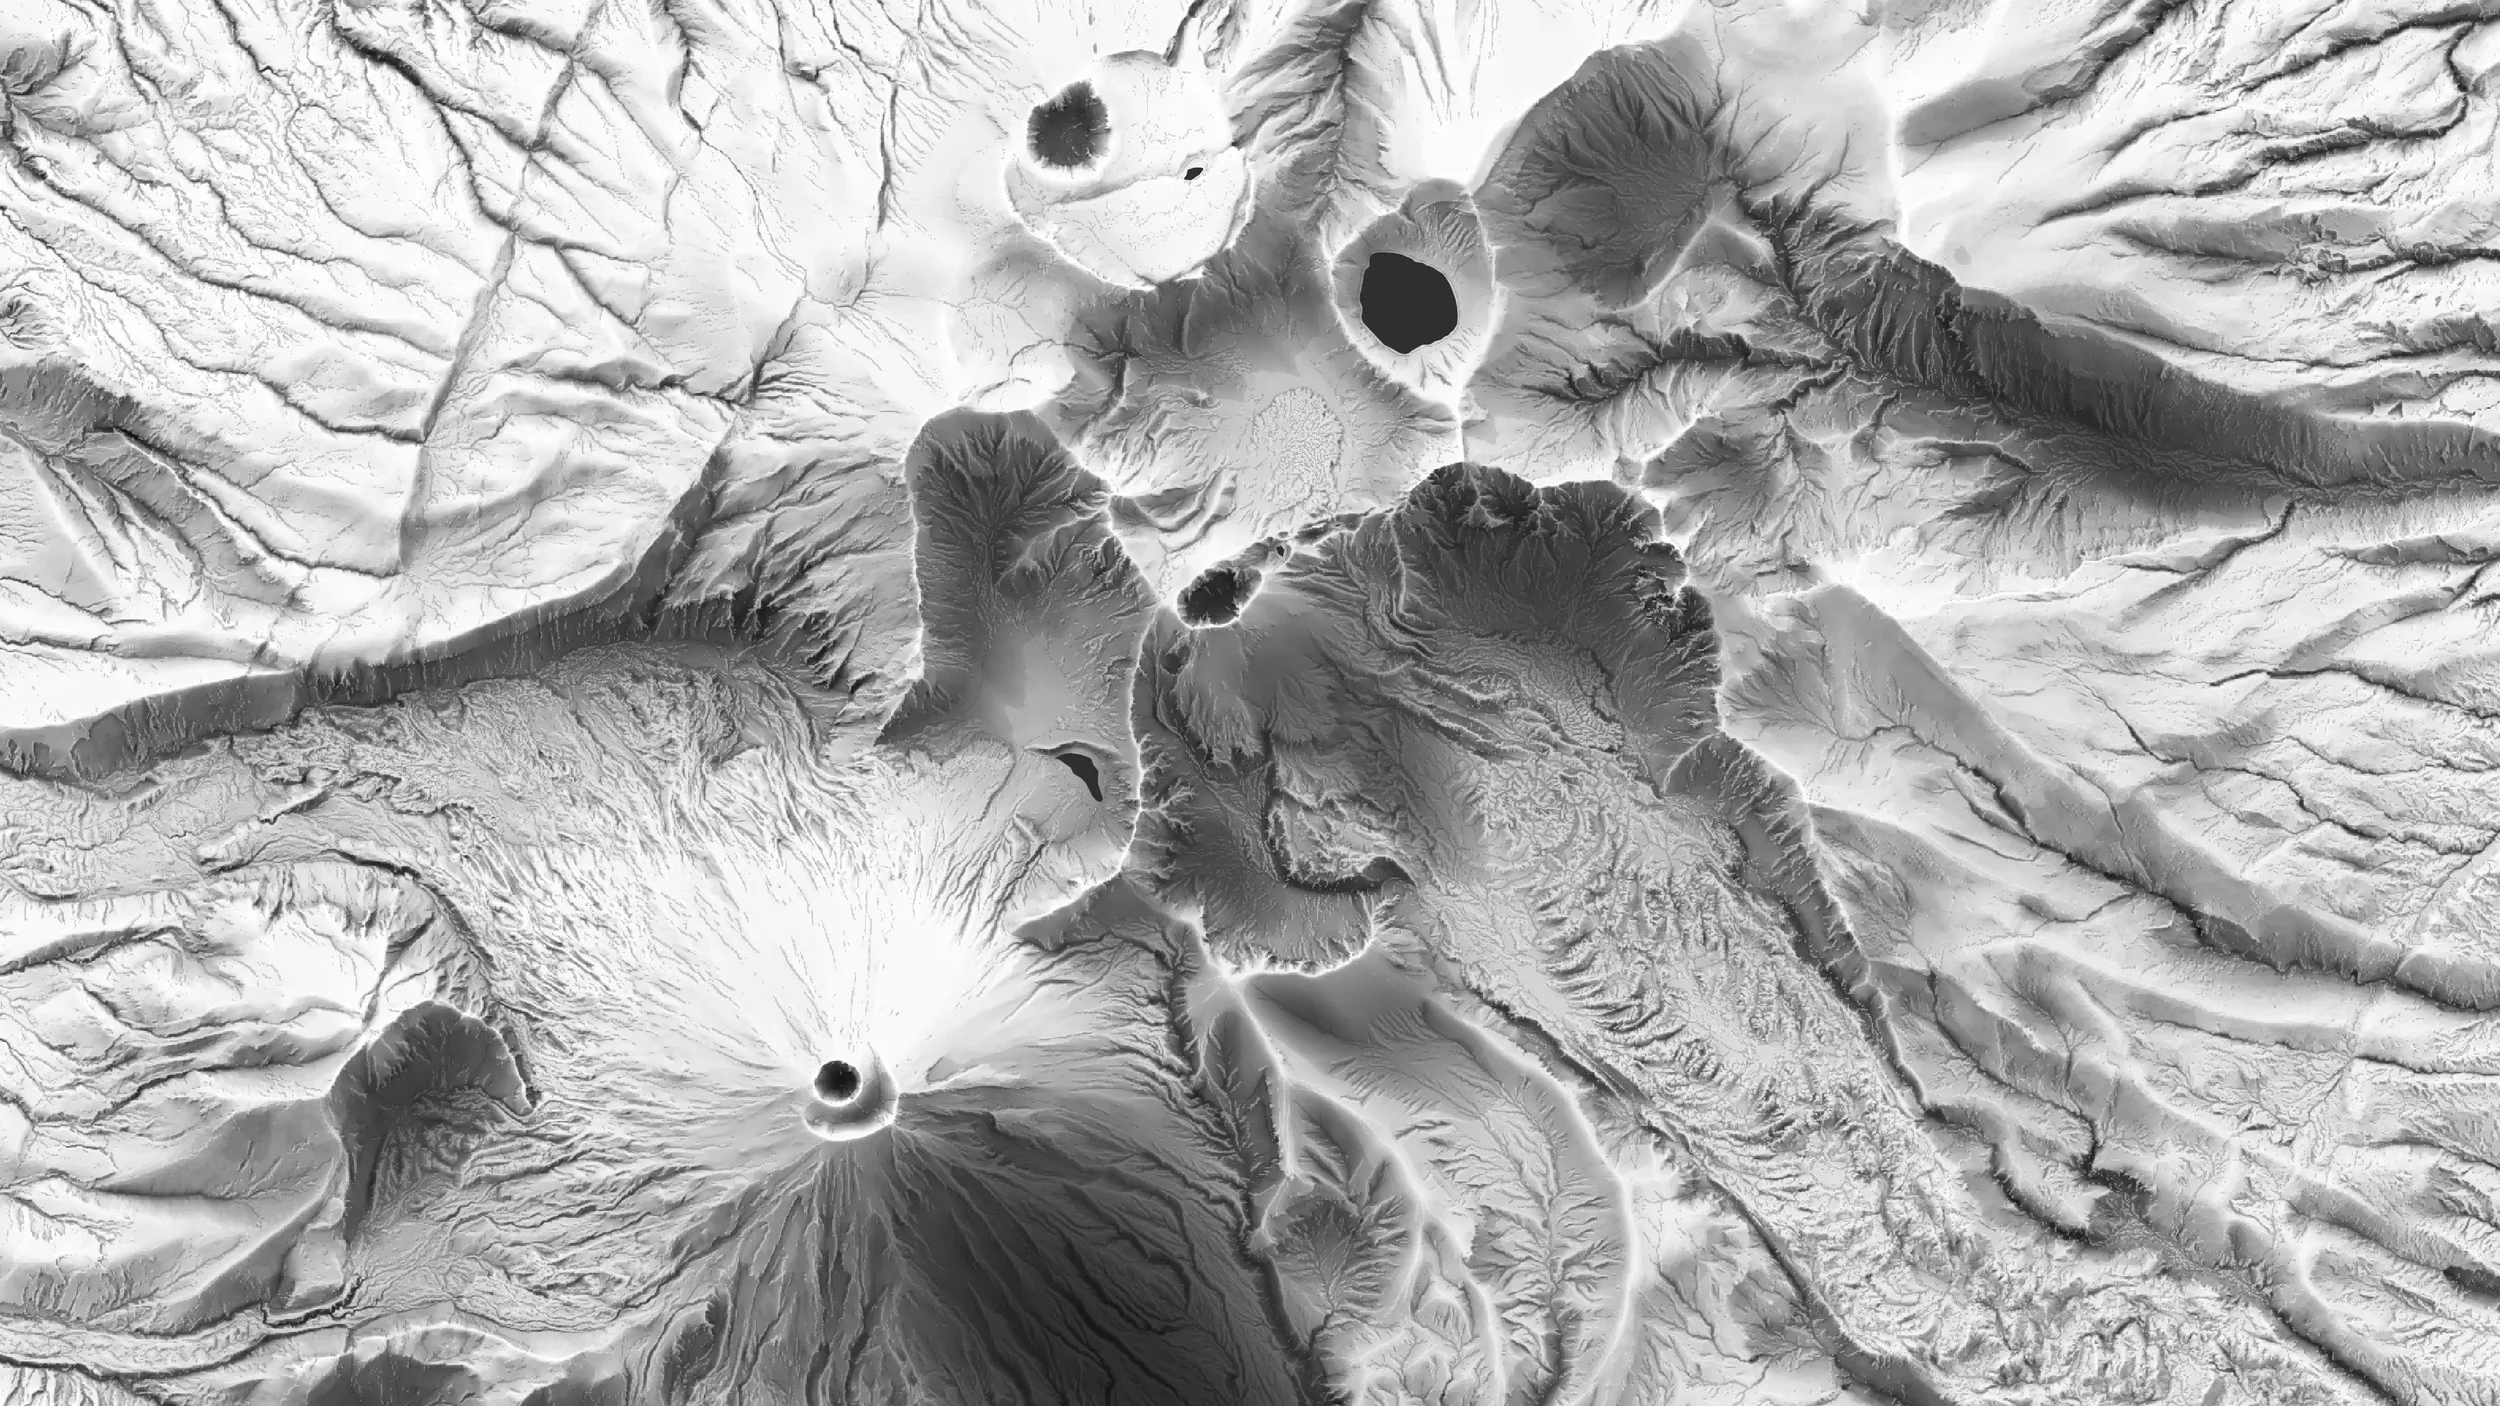
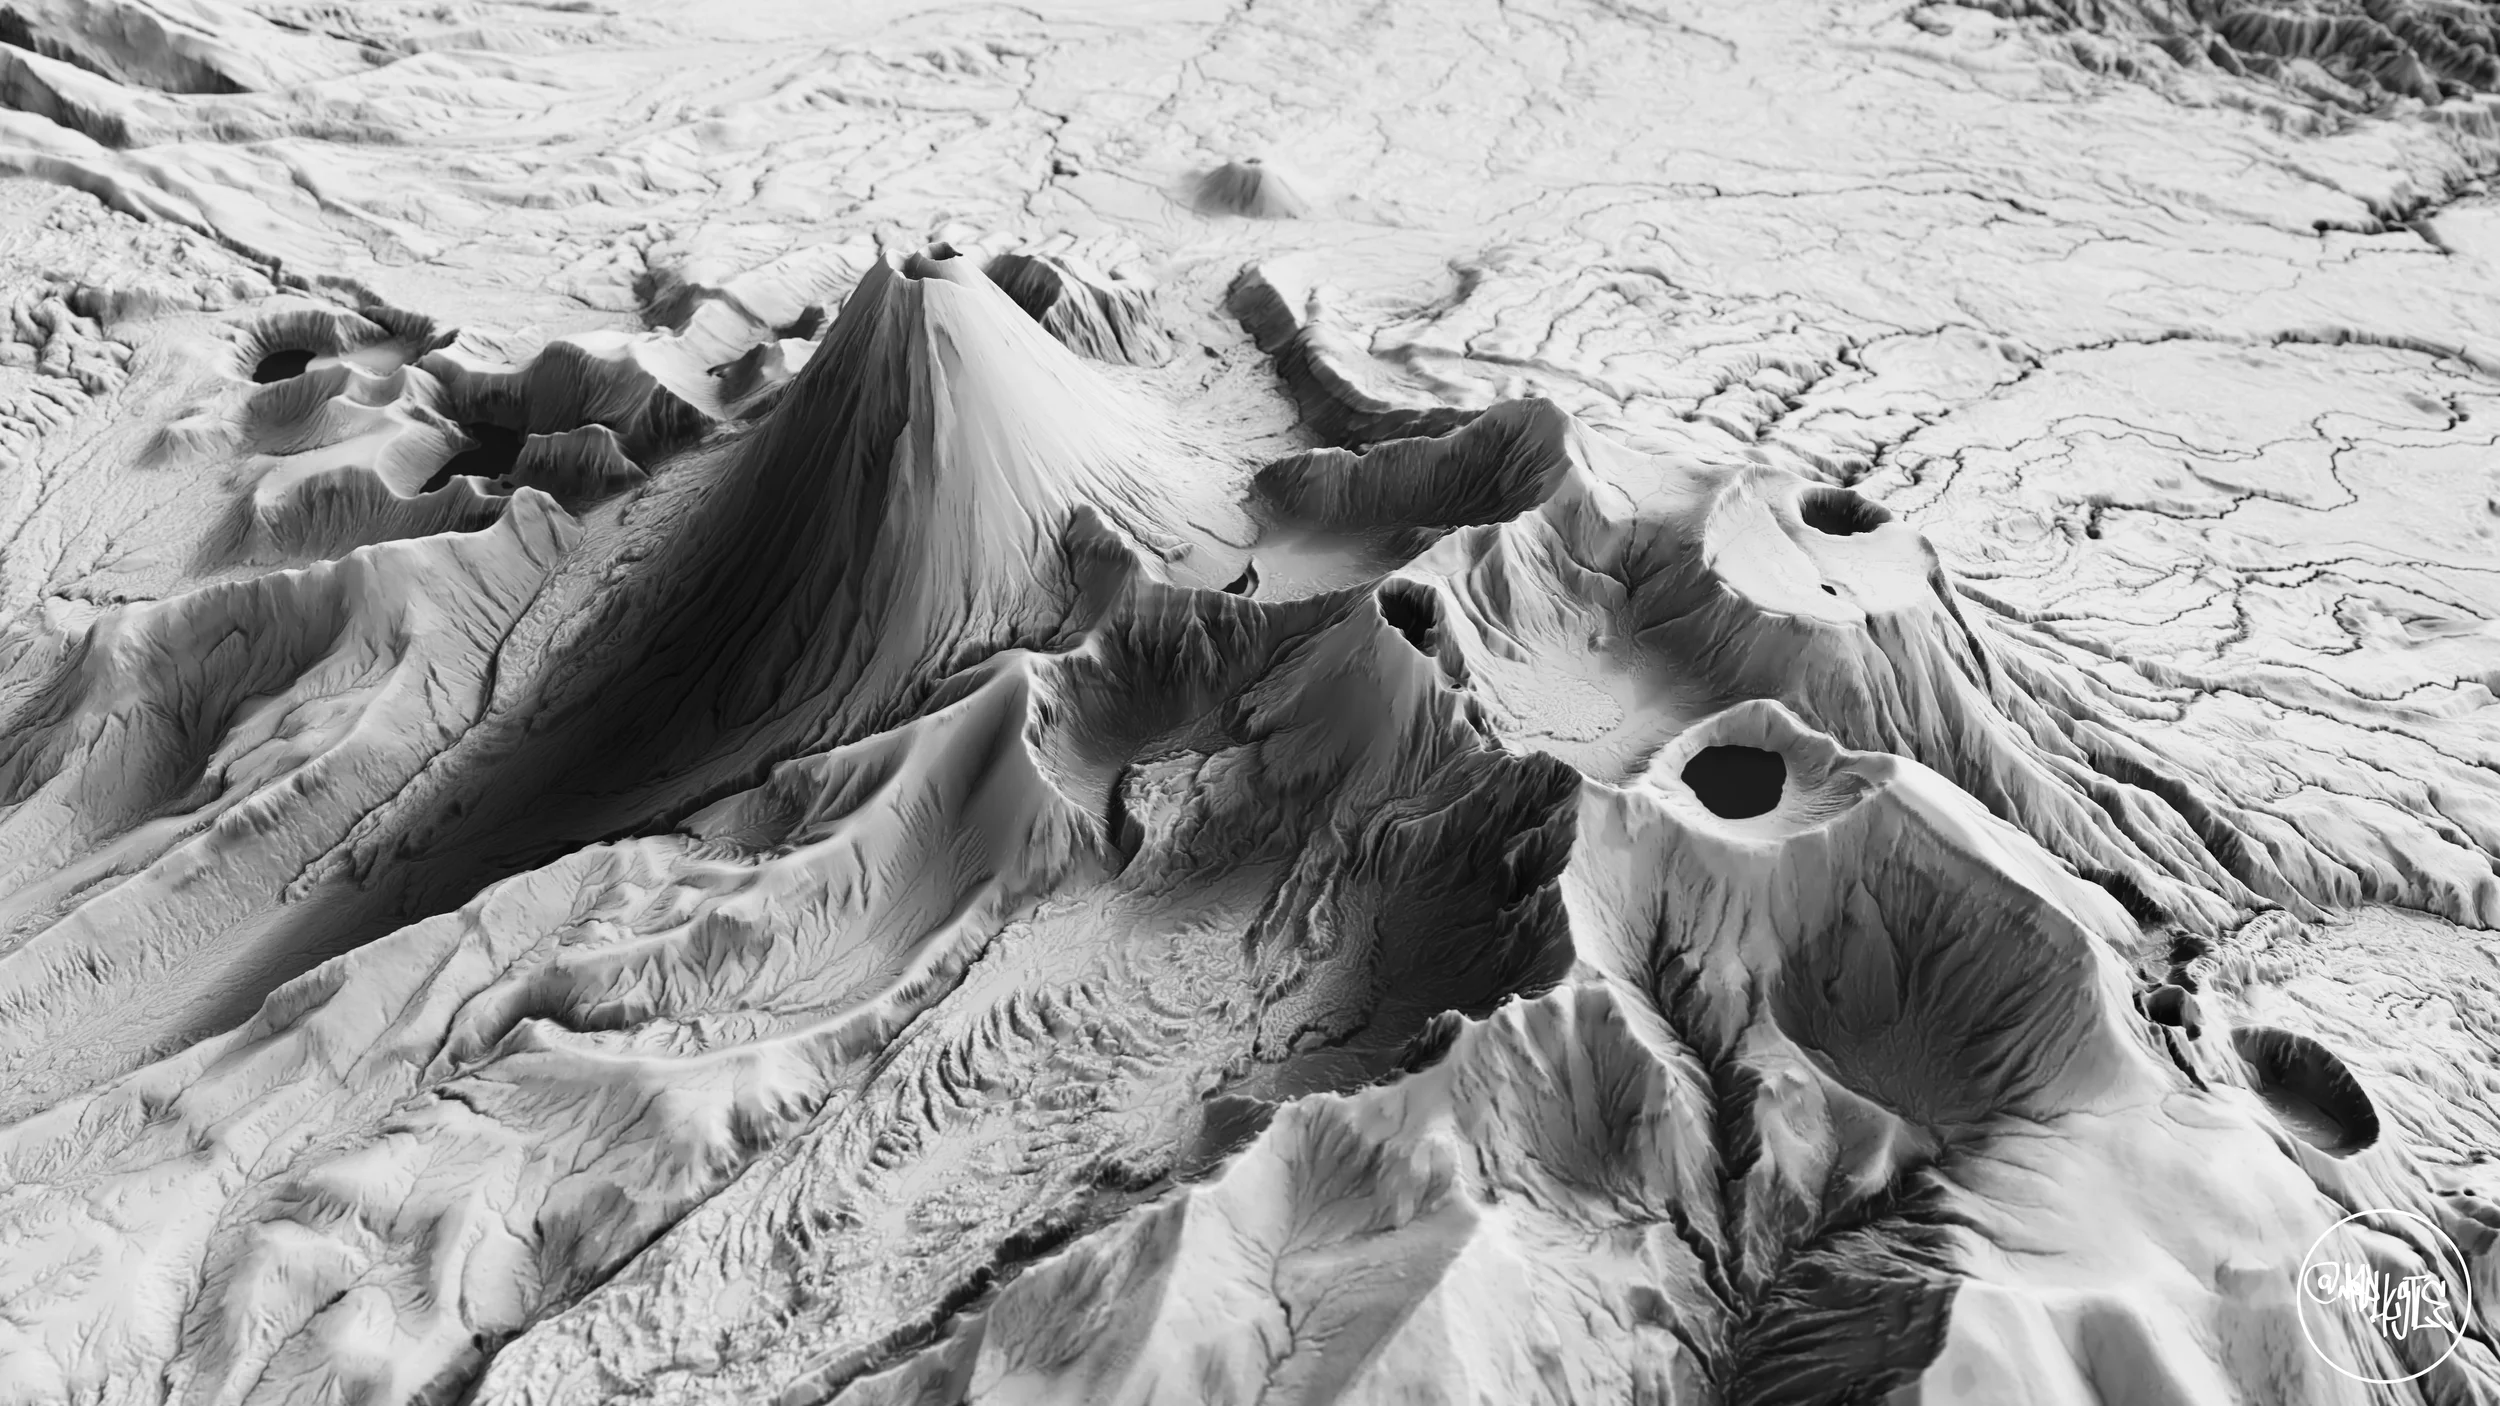
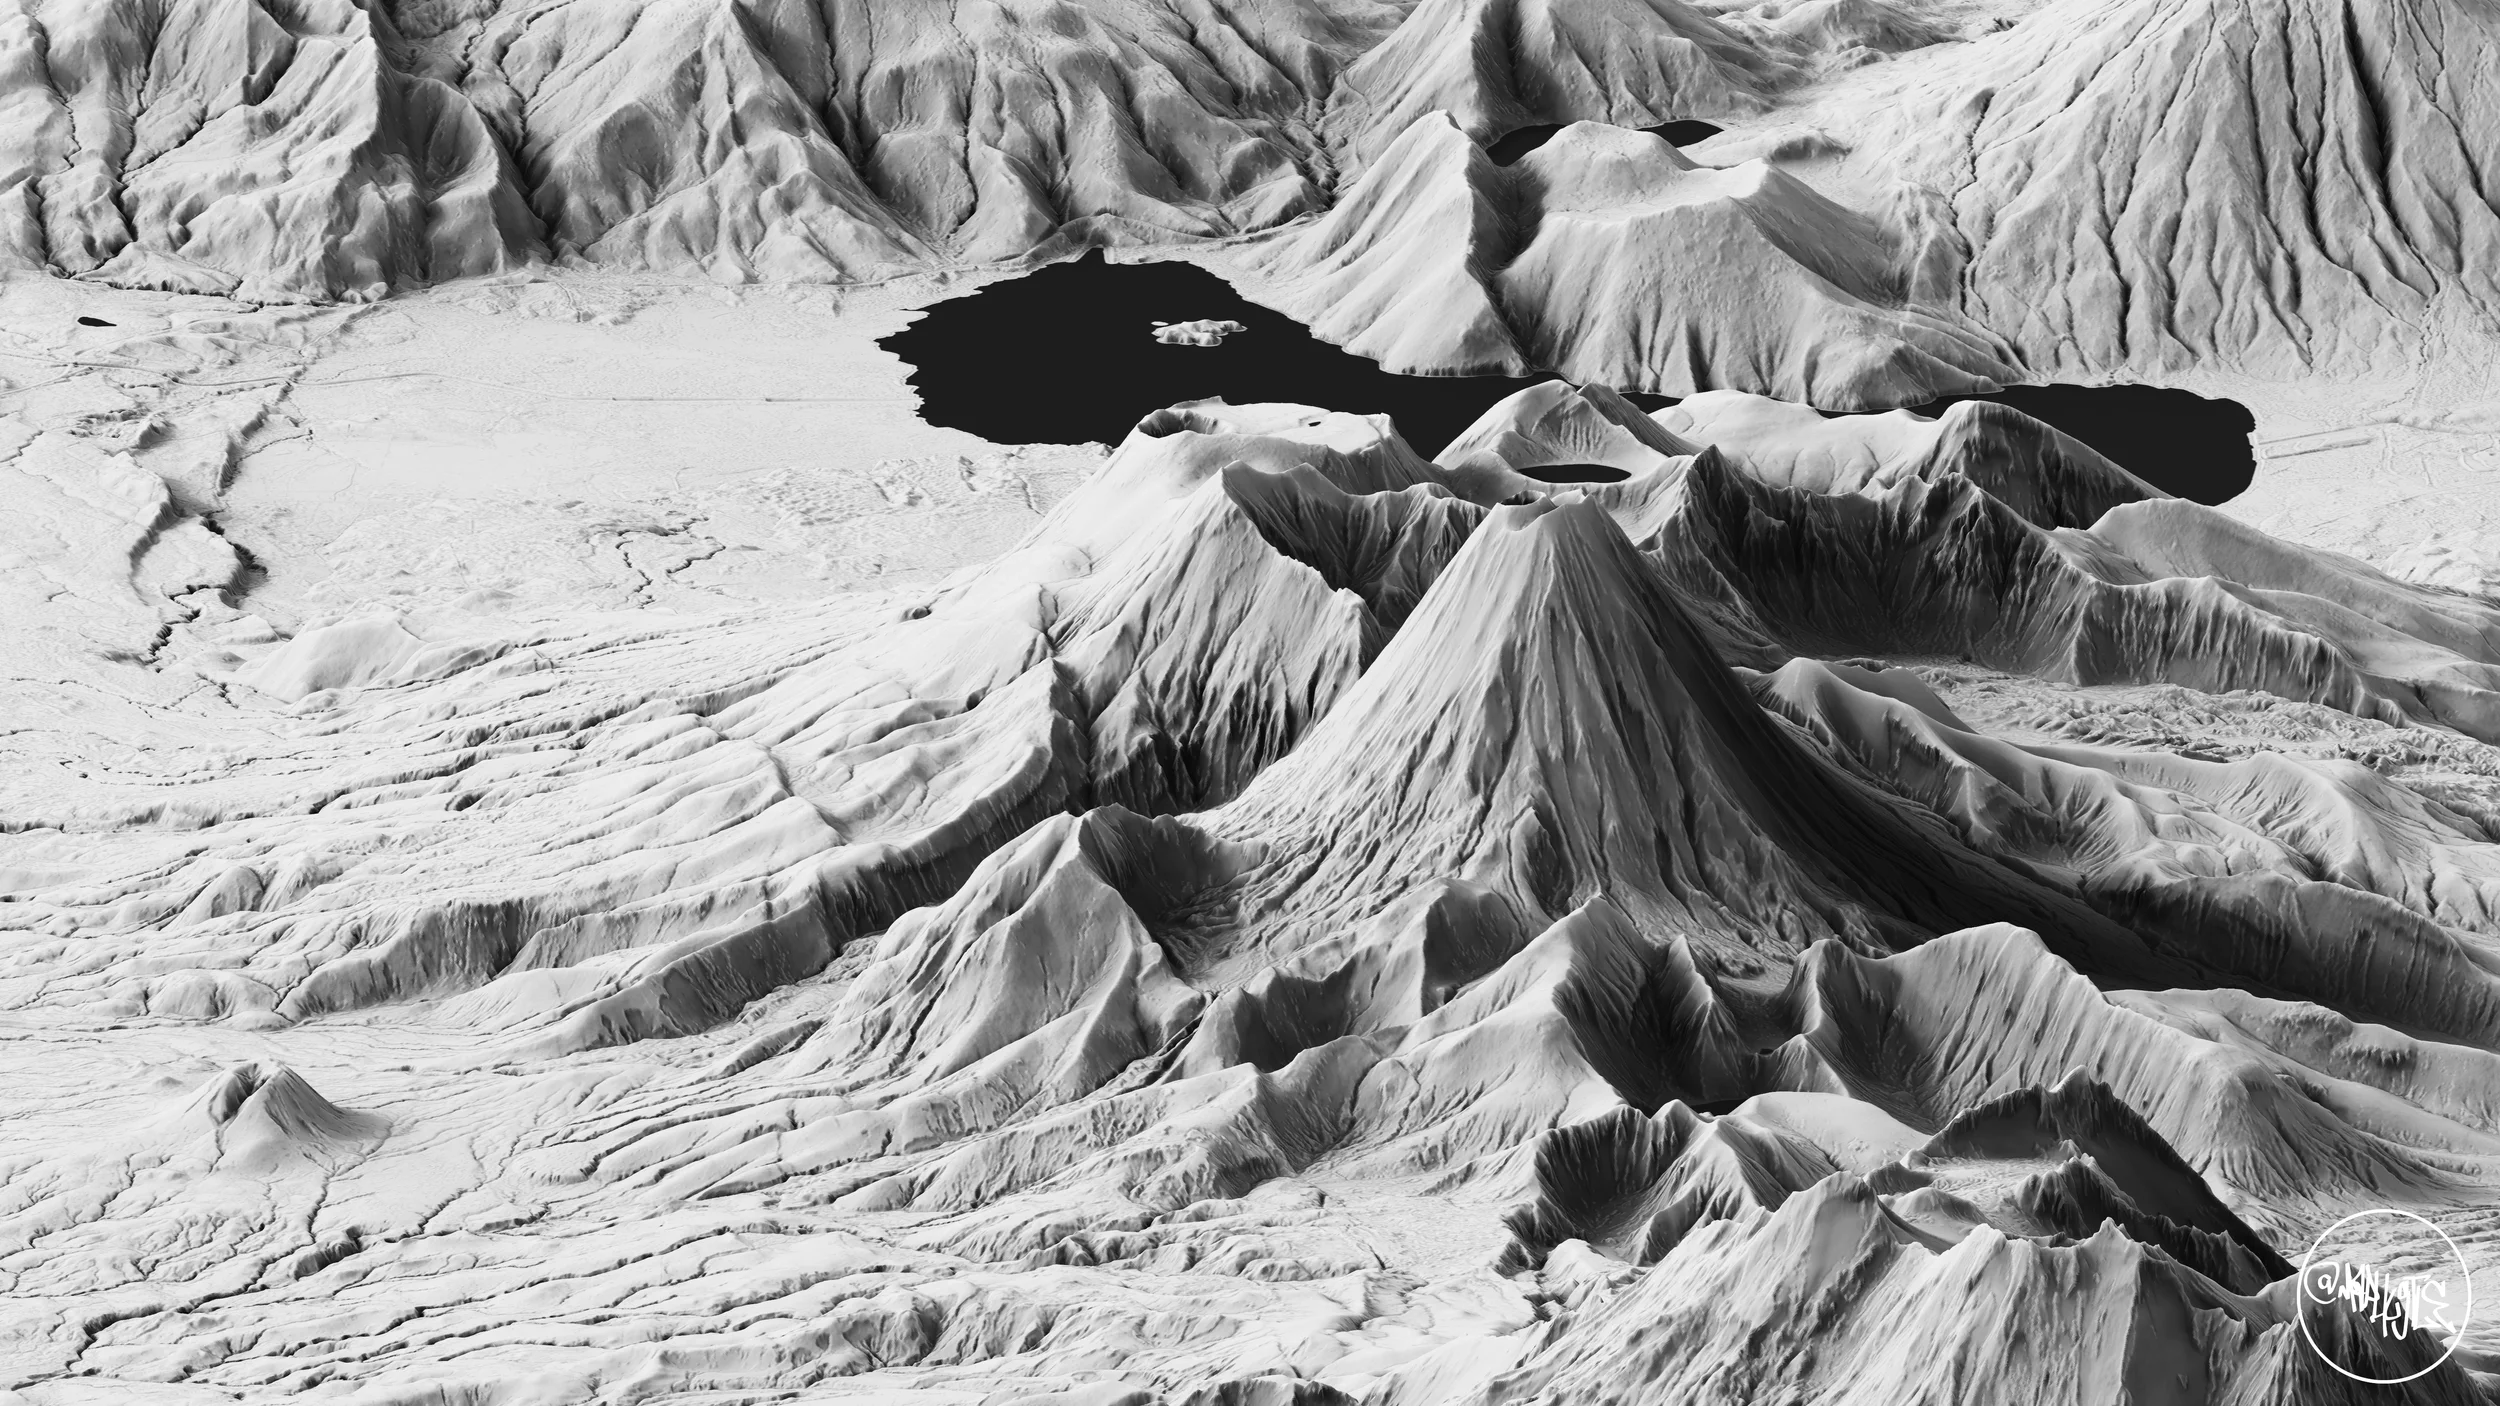
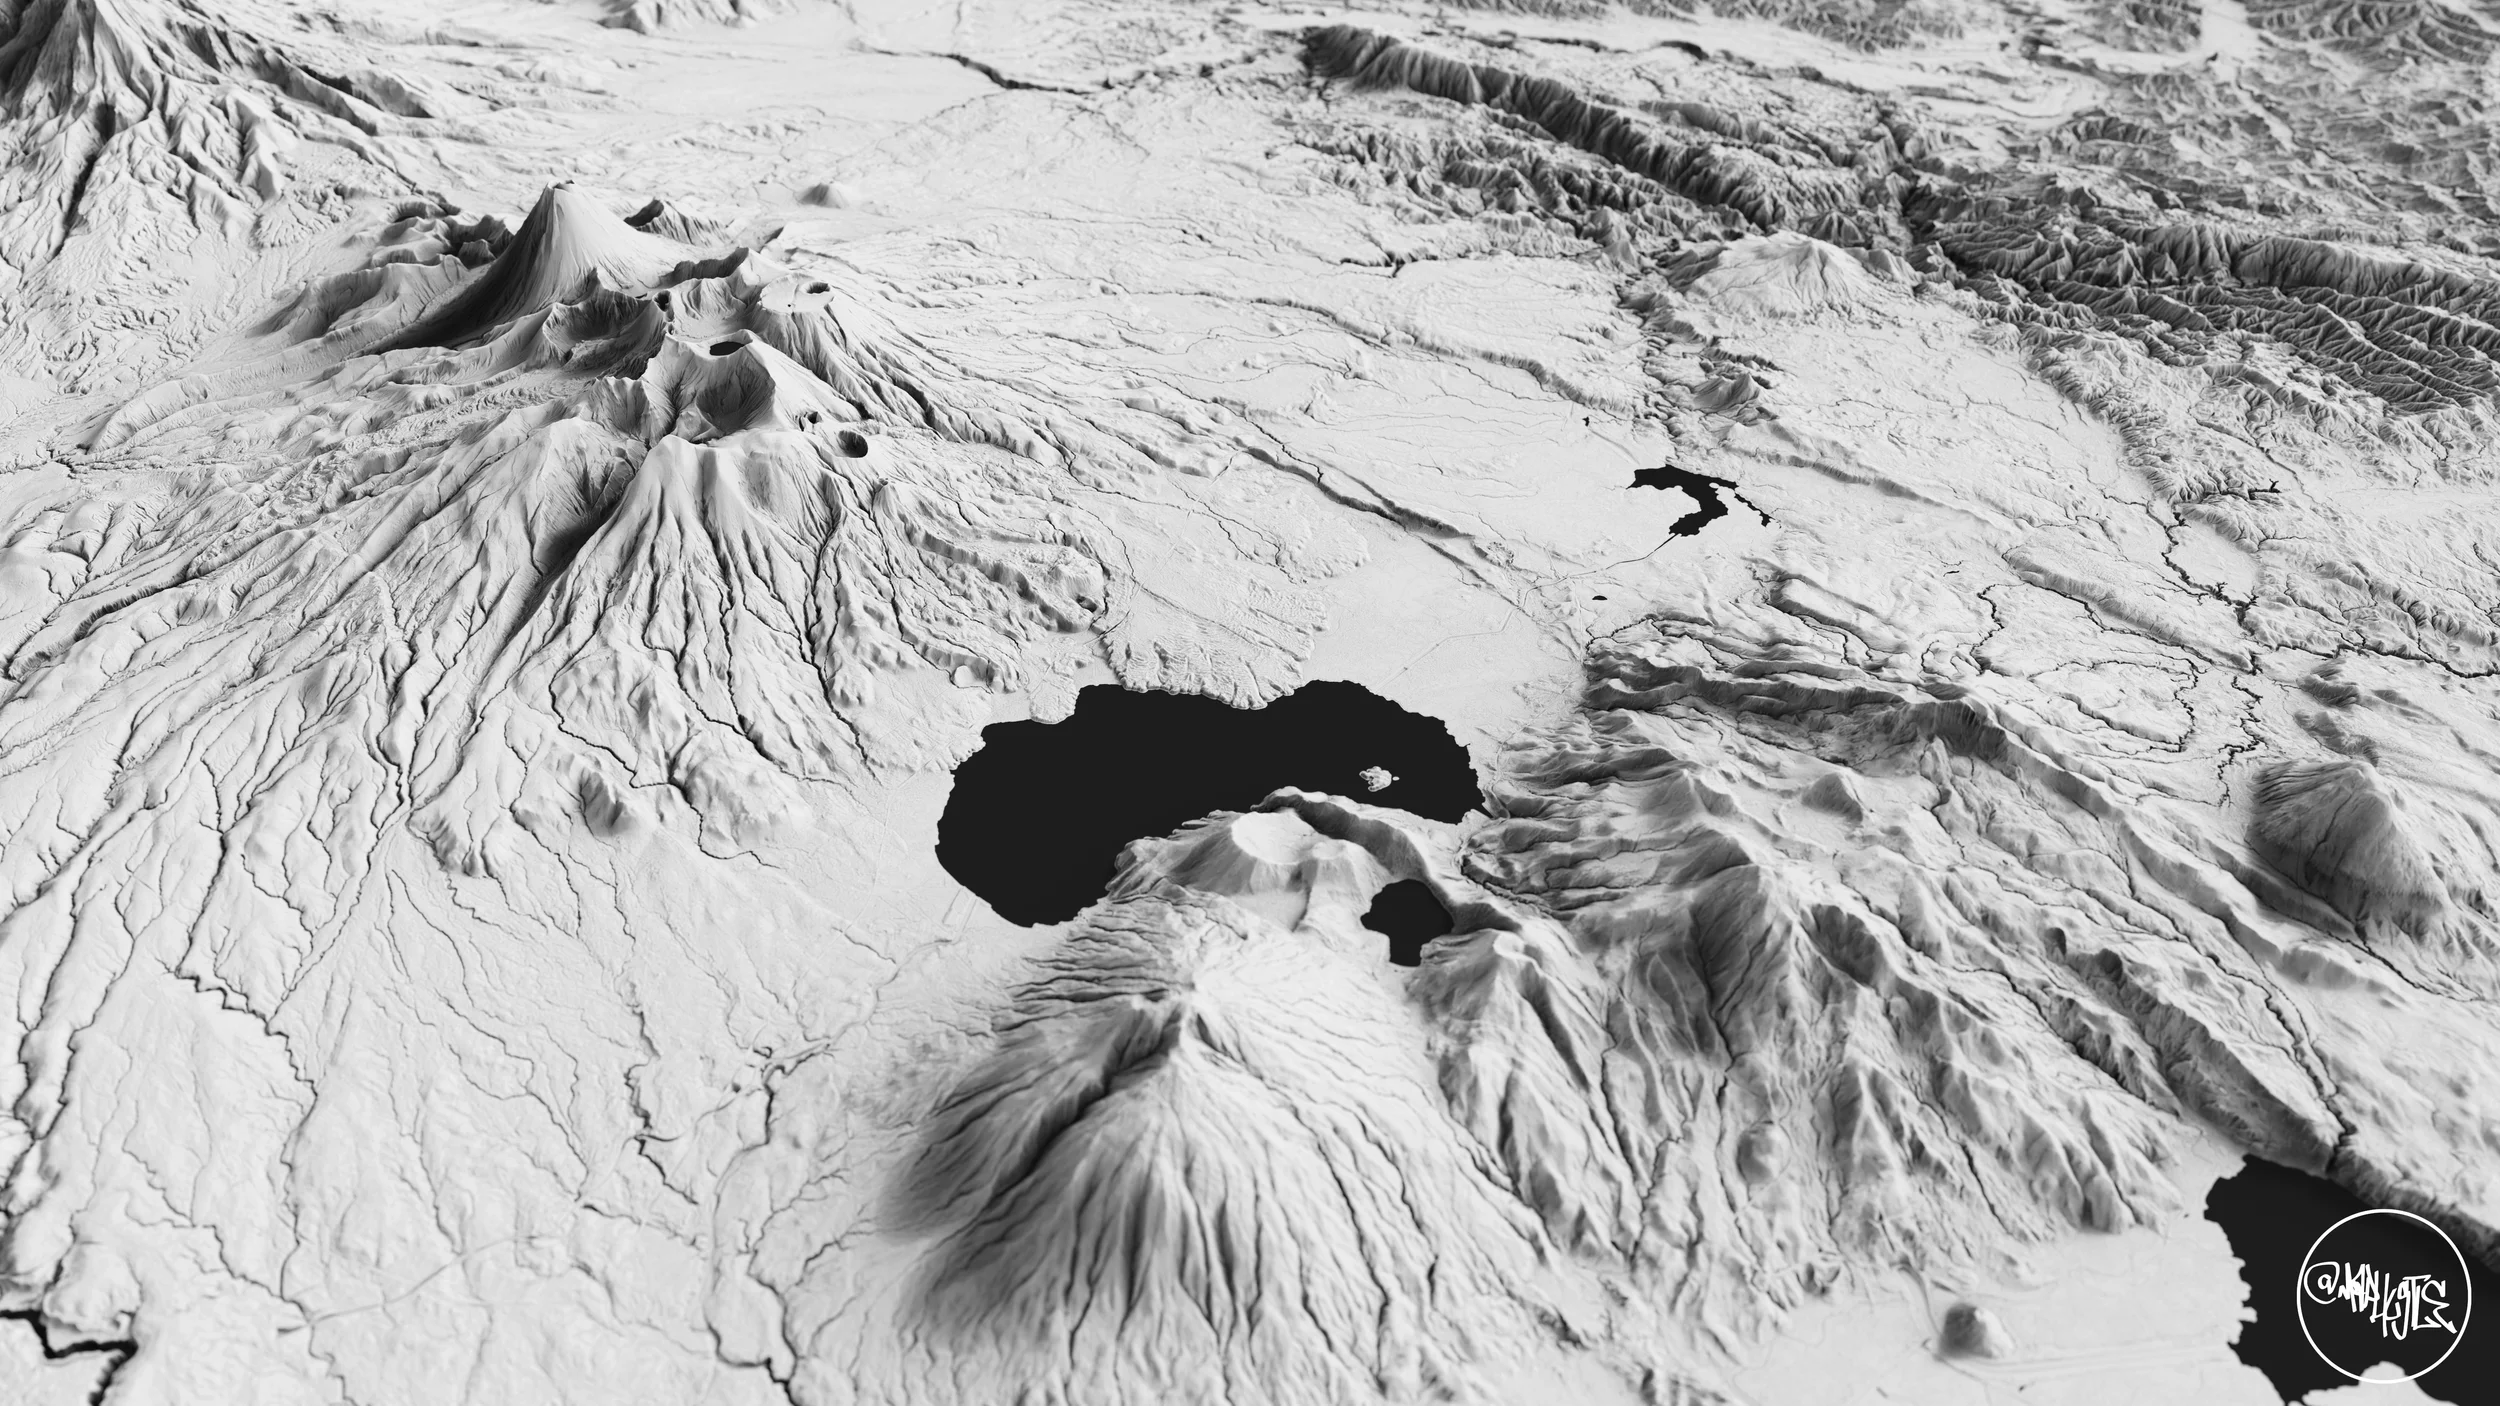
The park is dominated by three active volcanic peaks: Mt Tongariro, Mt Ngauruhoe, and Mt Ruapehu. These volcanoes shape a dramatic landscape of lava flows, craters, alpine deserts, emerald lakes, and steaming vents.
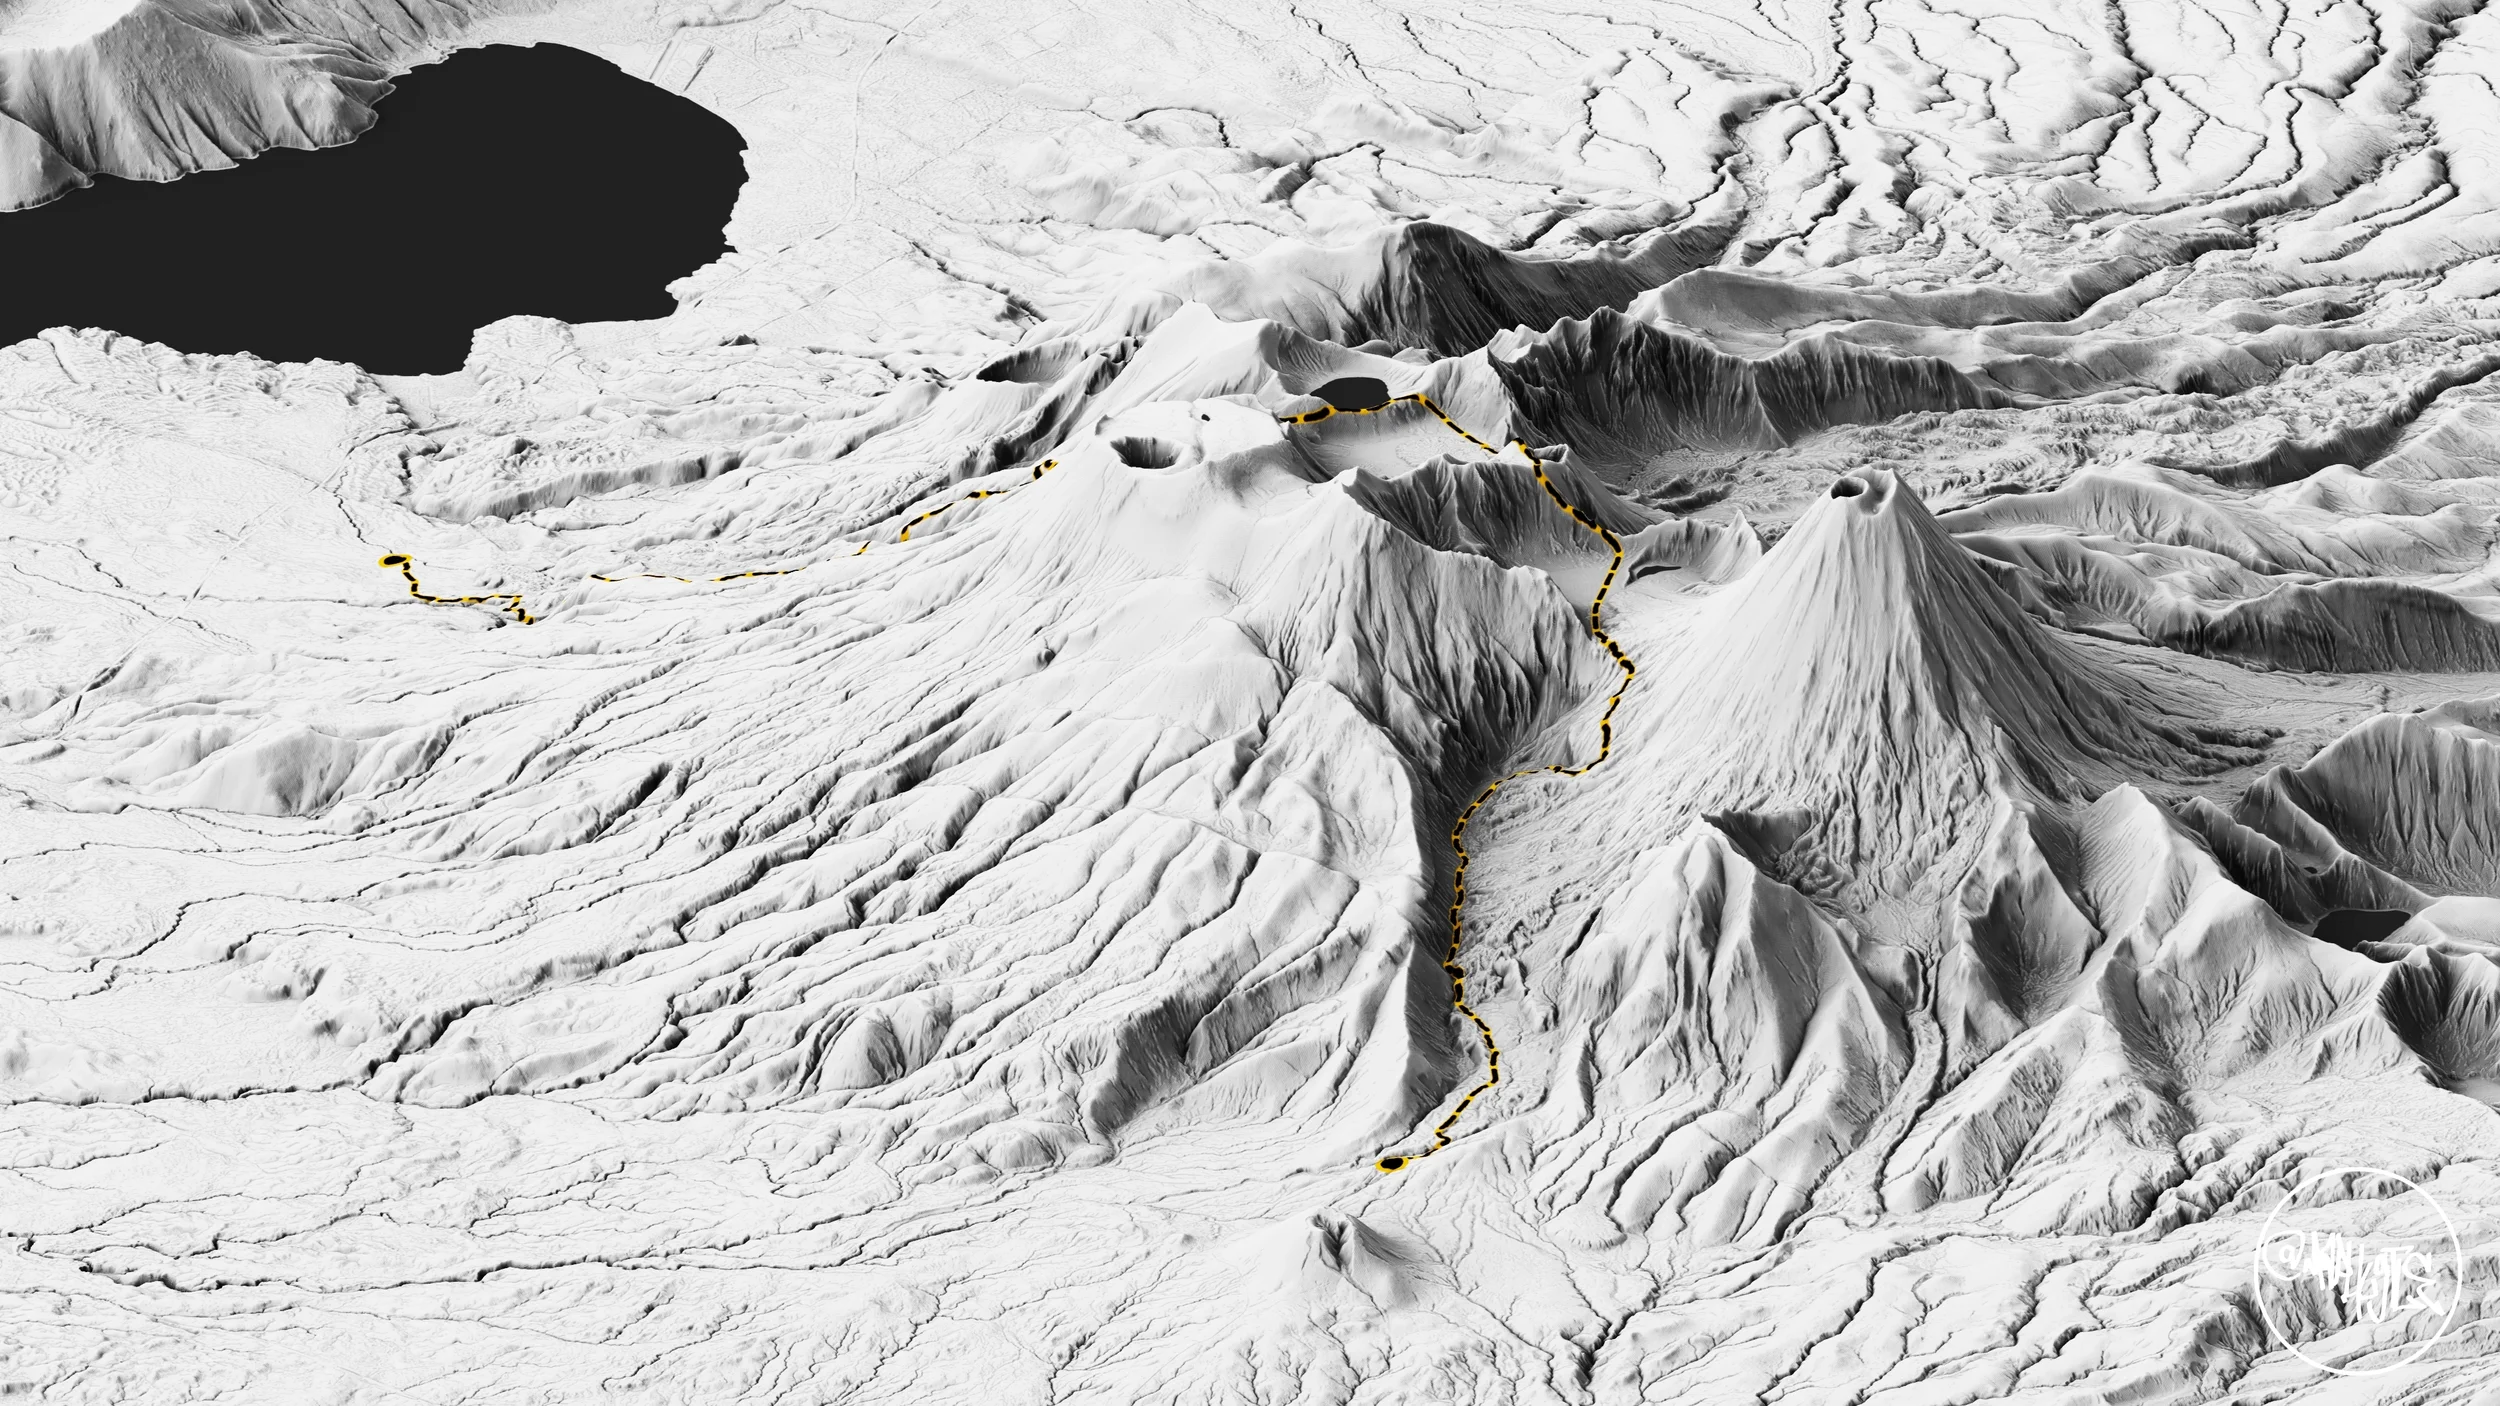
Ruapehu hosts two major ski fields, and Tongariro is known for the Tongariro Alpine Crossing. The Tongariro National Park is around 790 square kilometers and is the largest national park in the North Island.
Manawatū-Whanganui Region
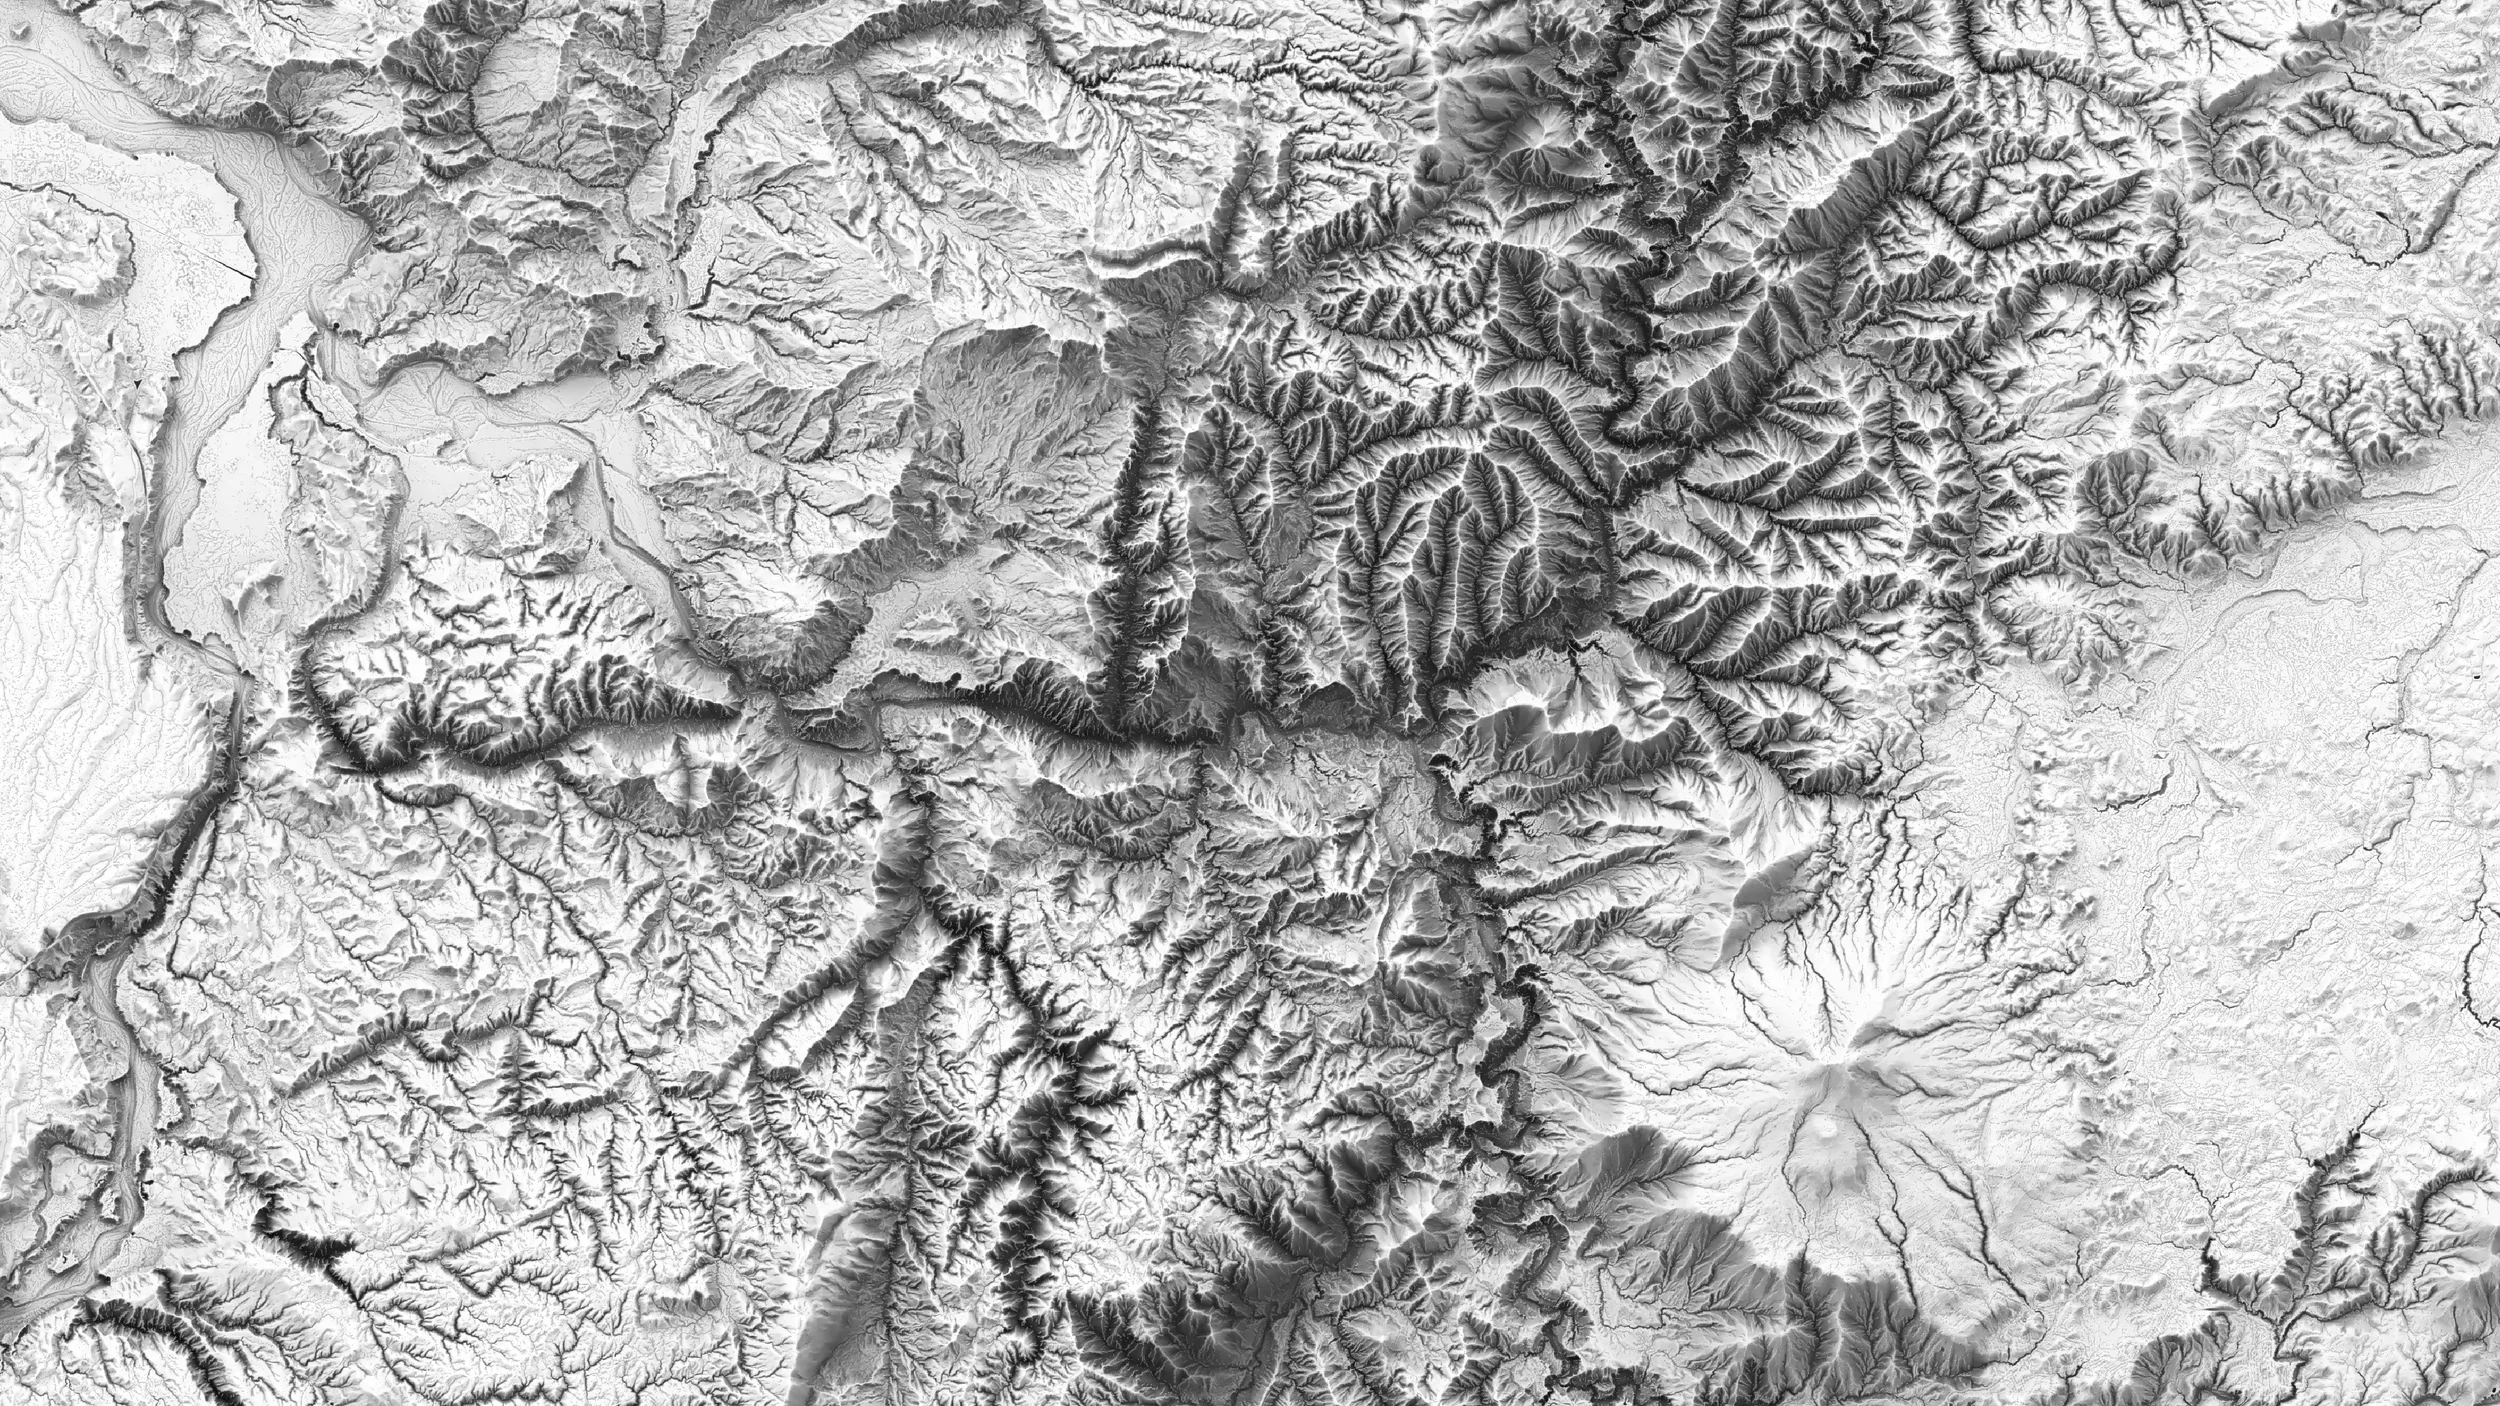
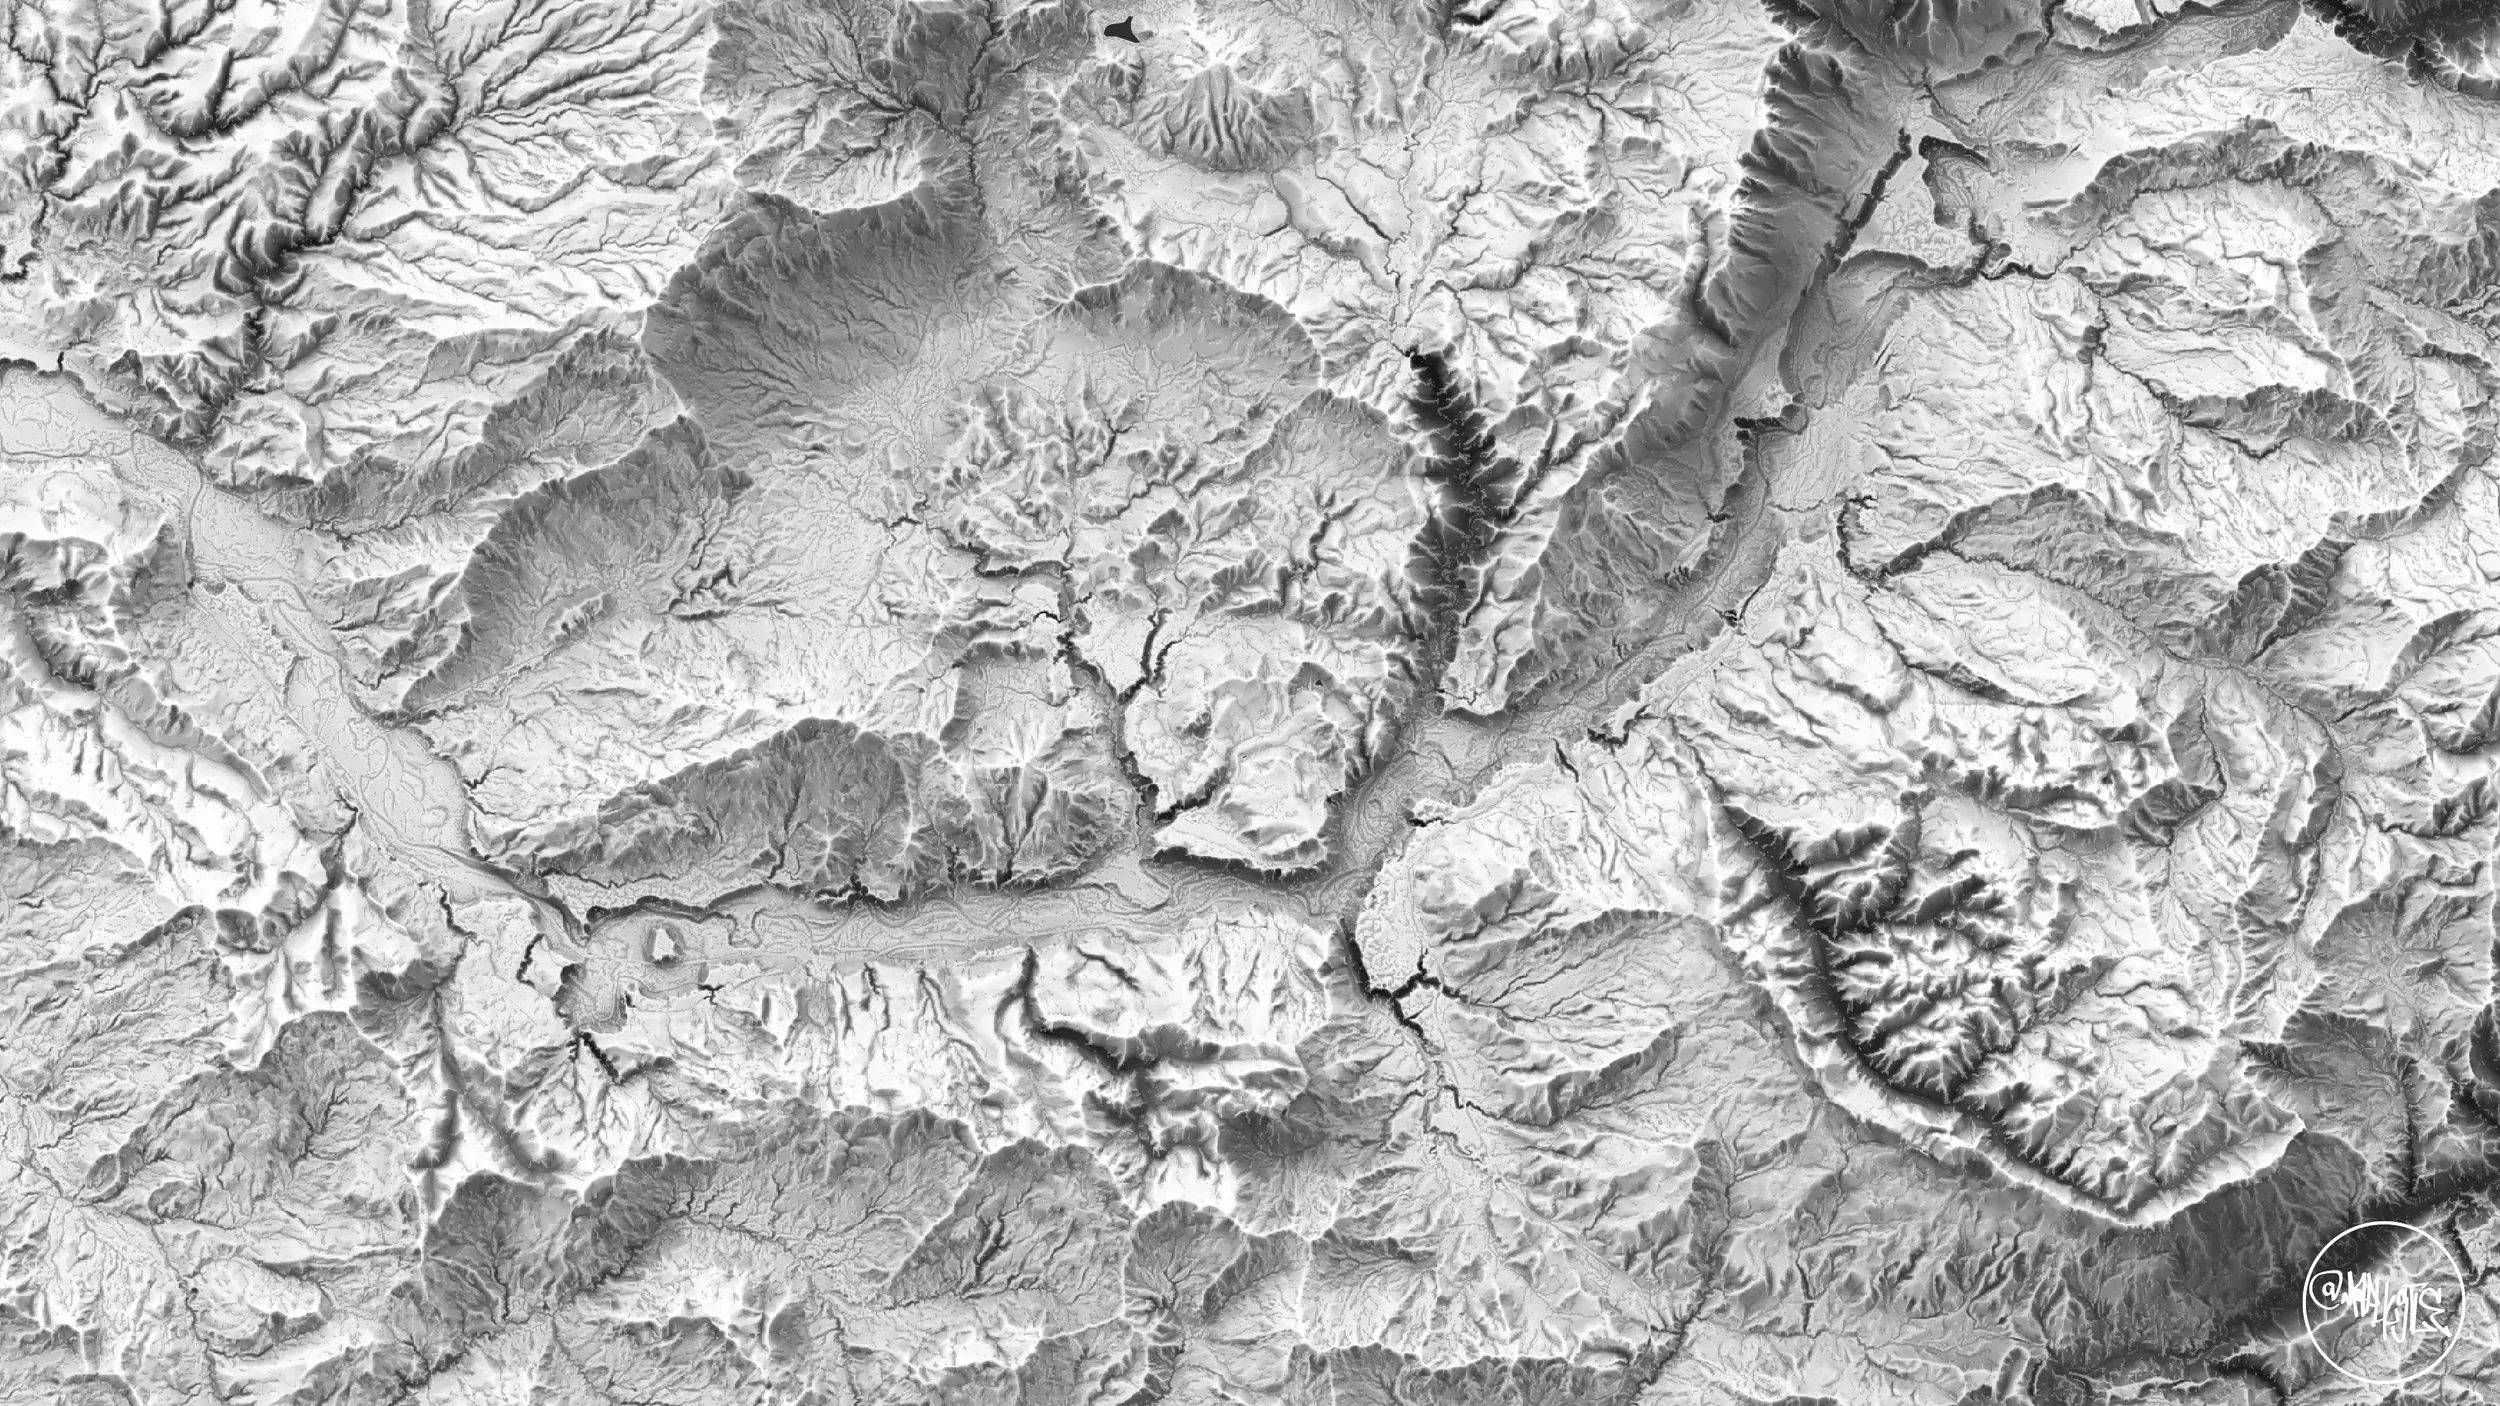
The Manawatū-Whanganui region contains volcanic plateaus and lava fields that give way to rolling hill country, deep river gorges, and broad pastoral plains.
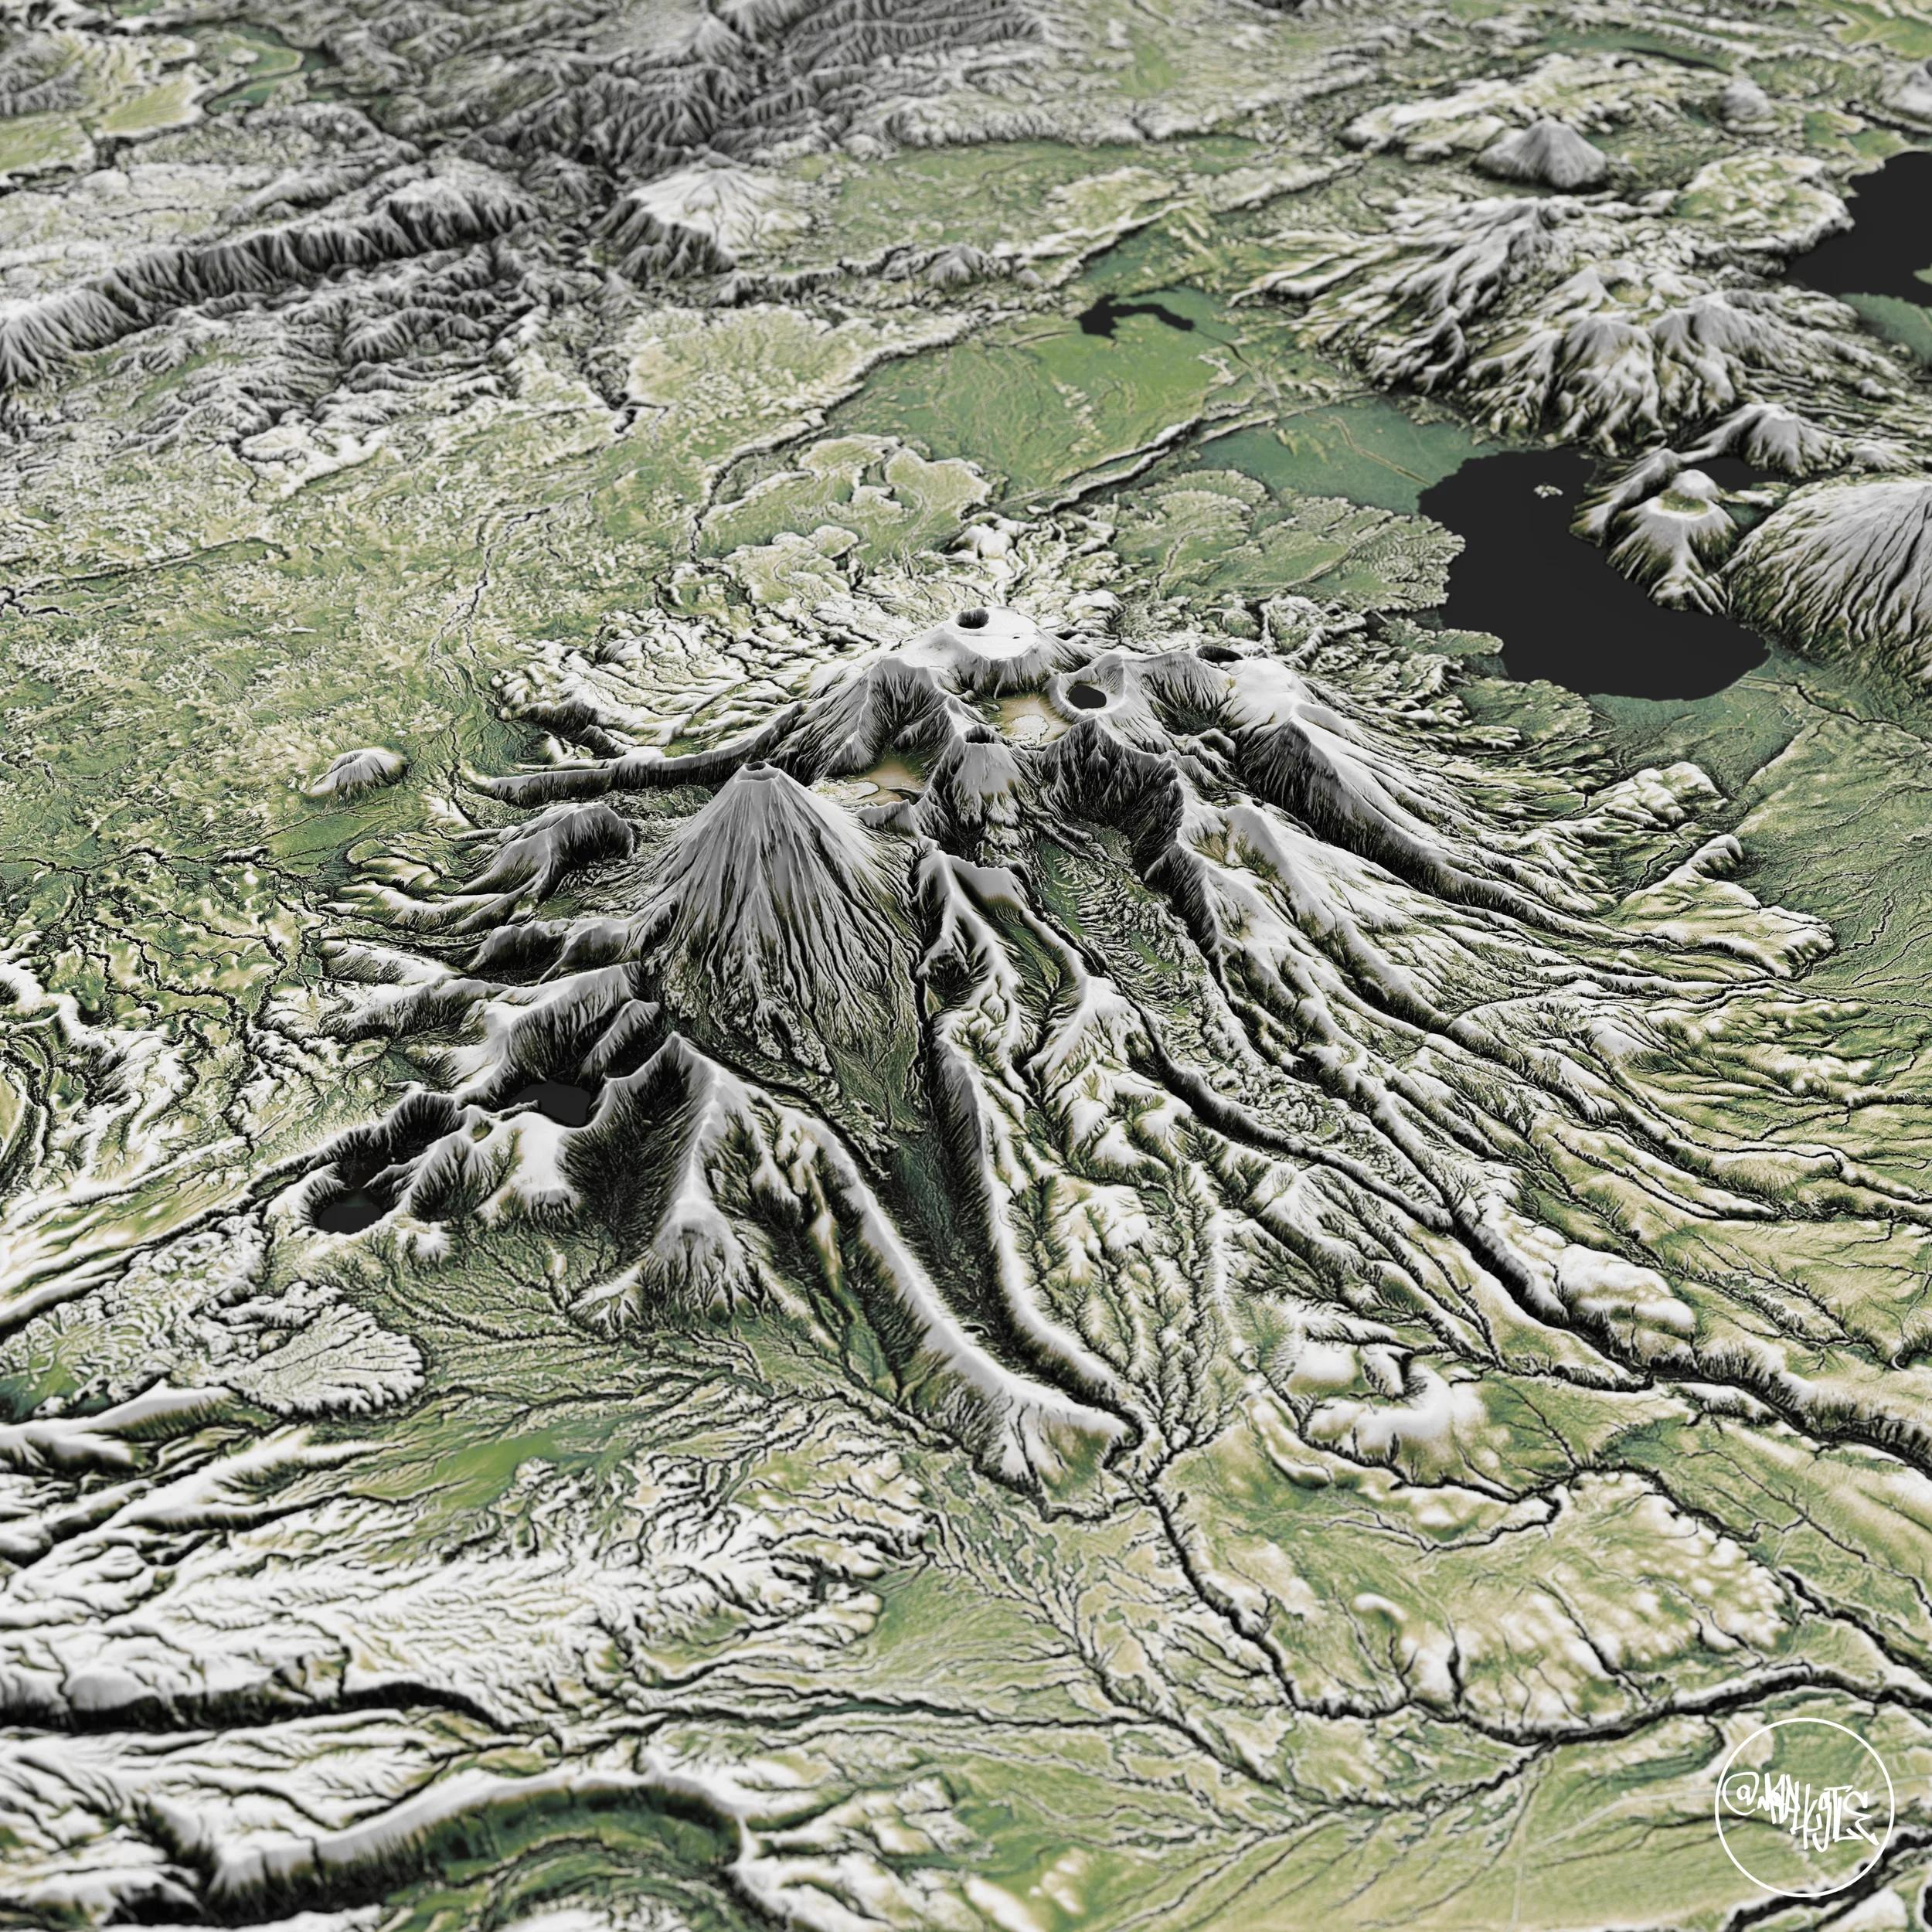
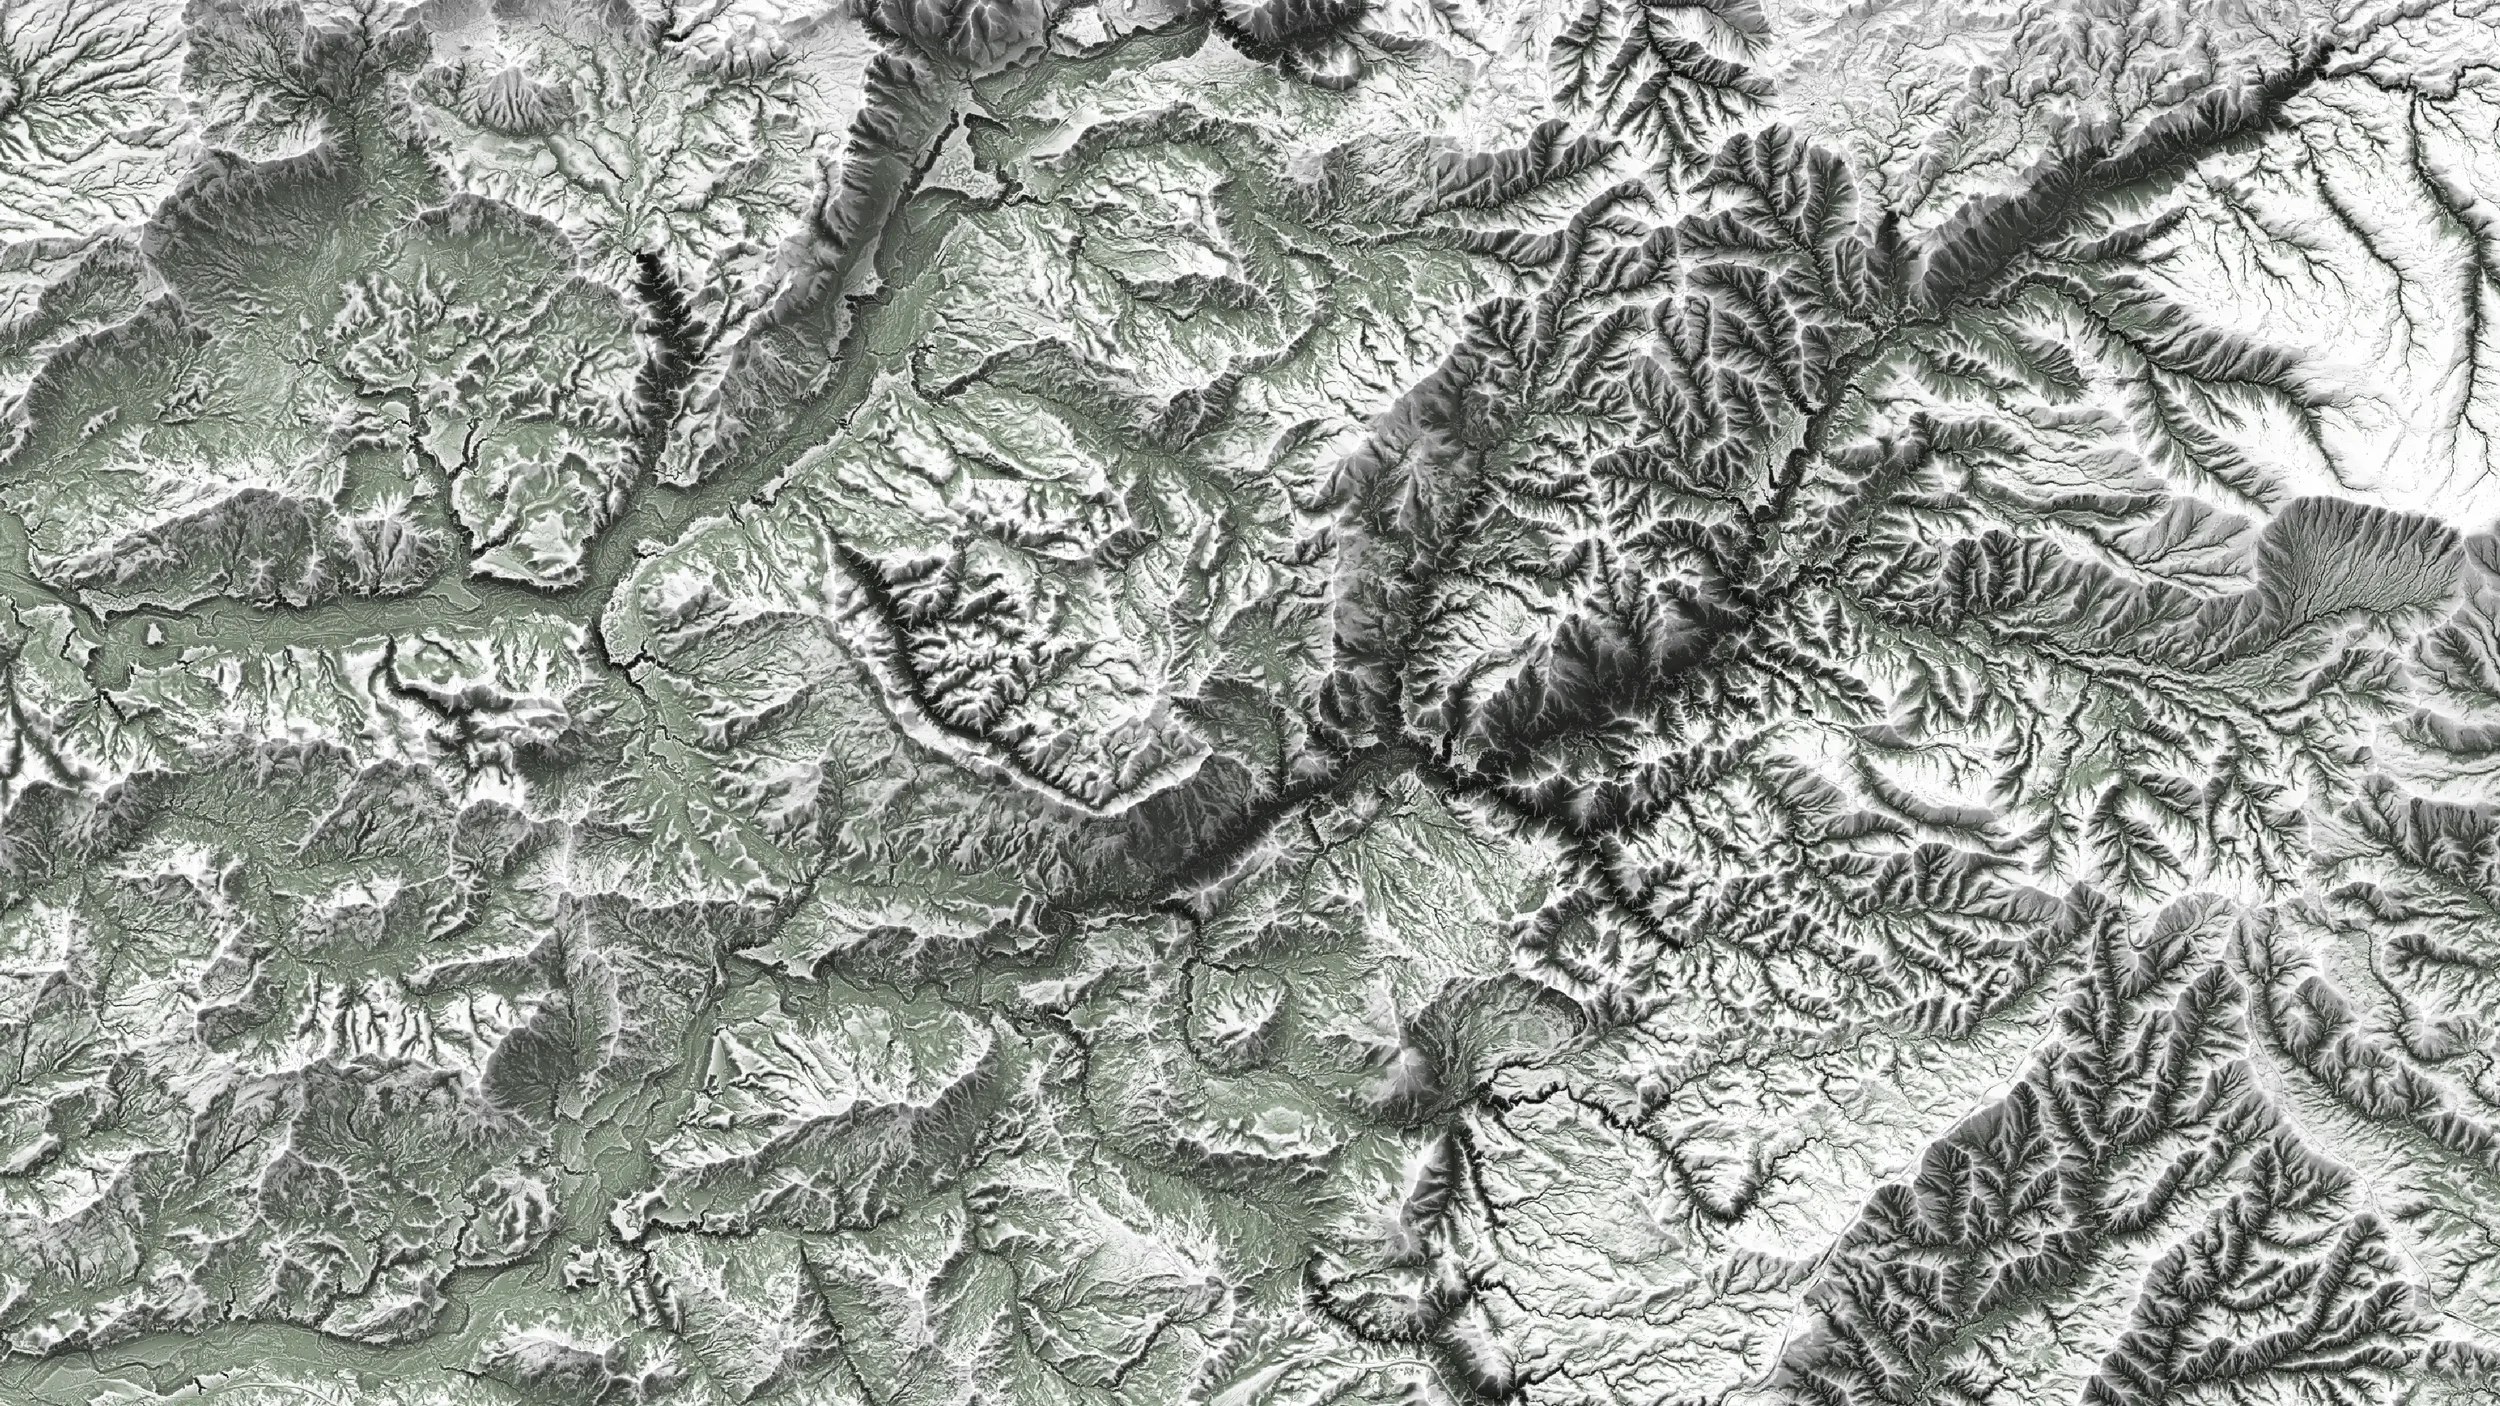
Snow-capped peaks and alpine tussock dominate the central highlands, while radiating rivers, most notably the Whanganui River, carve forested valleys as they flow toward lower, greener farmland. In general, the region shows landscapes of stark contrasts.
The data used is a 1 m LiDAR-derived DEM, resampled to a 5 m resolution. Please see the Data Attribution section at the end of this blog for the datasets names and how to access. Unfortunately, the south eastern portion of Mt Ruapehu does not have this data coverage, so I have instead visualised where this data exists, not the entire park.
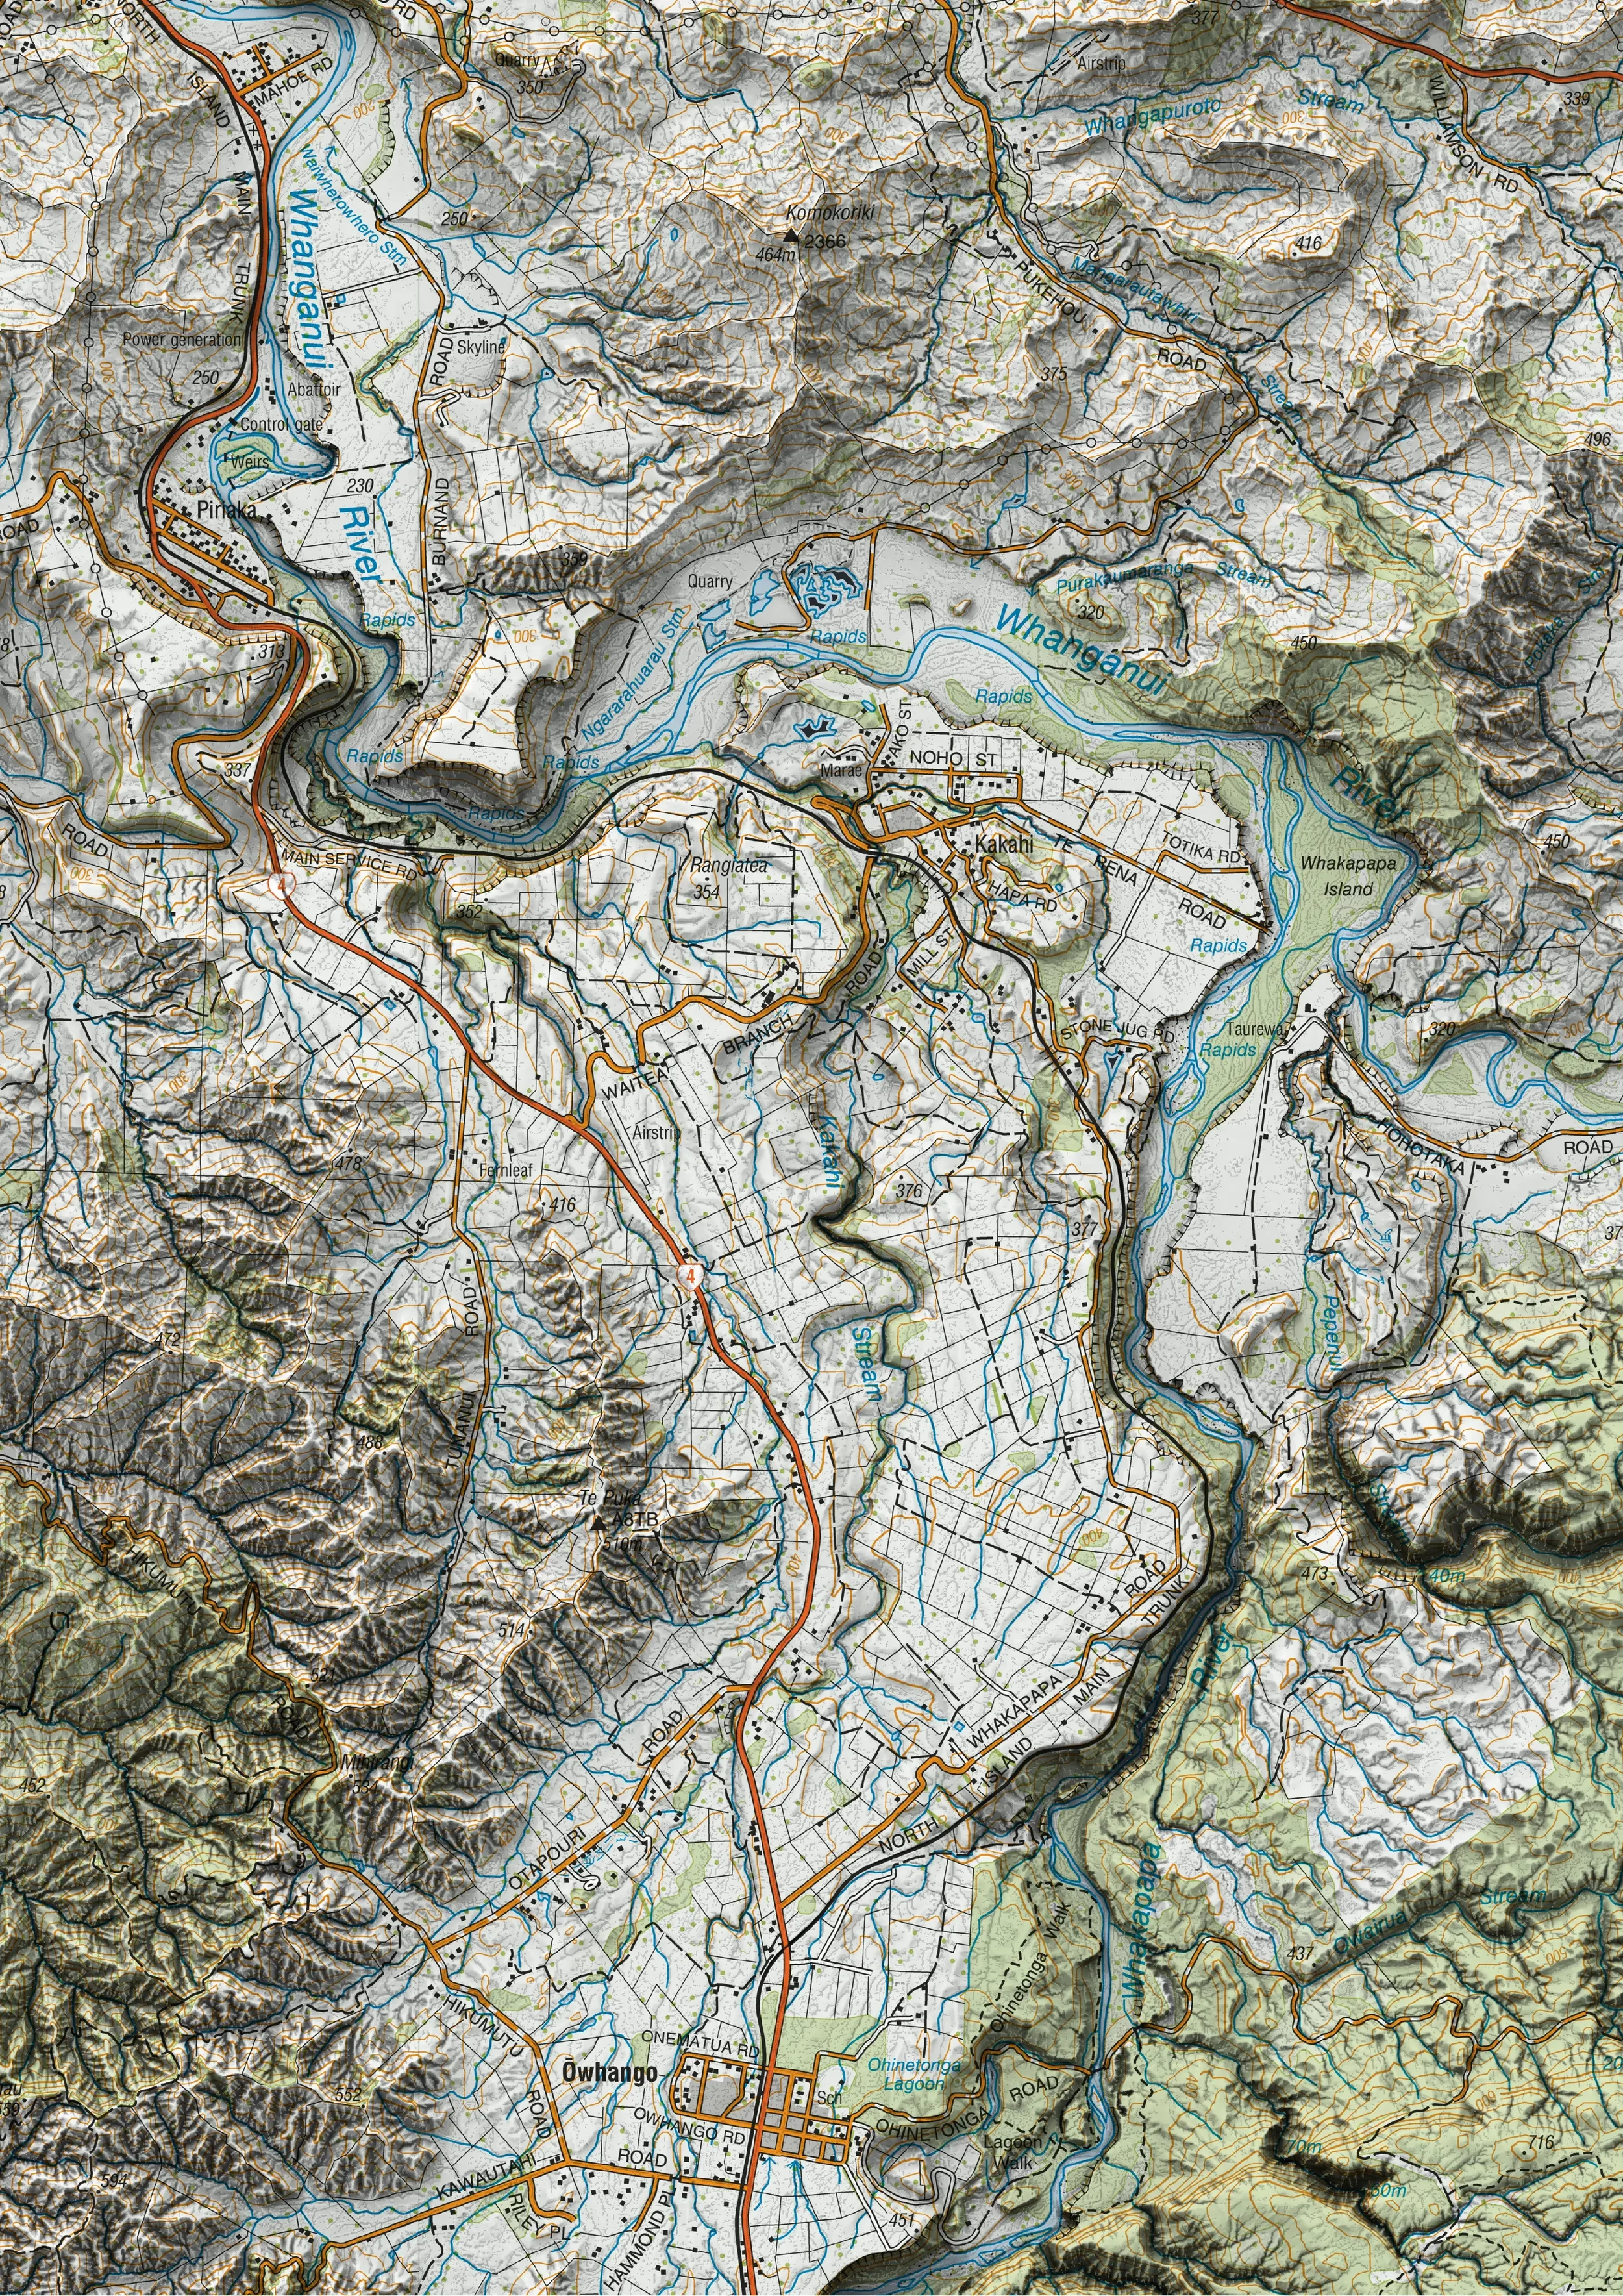
This map is intended to provide a sense of scale for the area being visualised. Creating a map was not part of the original plan, so the design is deliberately simple. Even so, its features should help orient the viewer and support an understanding of scale in the visualisations that follow.
A brief note on my output “style”: I prioritise landscape visibility over text legibility. My focus is on revealing terrain and form rather than layering extensive labels, marginalia, or explanatory text. As a result, my maps may be considered unconventional when judged against traditional cartographic standards, and some refinement is always possible.
I am consciously developing and remaining true to a personal style that is still evolving. I am hesitant to produce work that closely resembles what already exists. Given that the Tongariro Alpine Crossing is a well-travelled route with many excellent maps already available, this map of Tongariro National Park is presented with a different emphasis: showing the lay of the land above all else, and to provide enough context to support the rest of this virtual gallery.
The Gallery
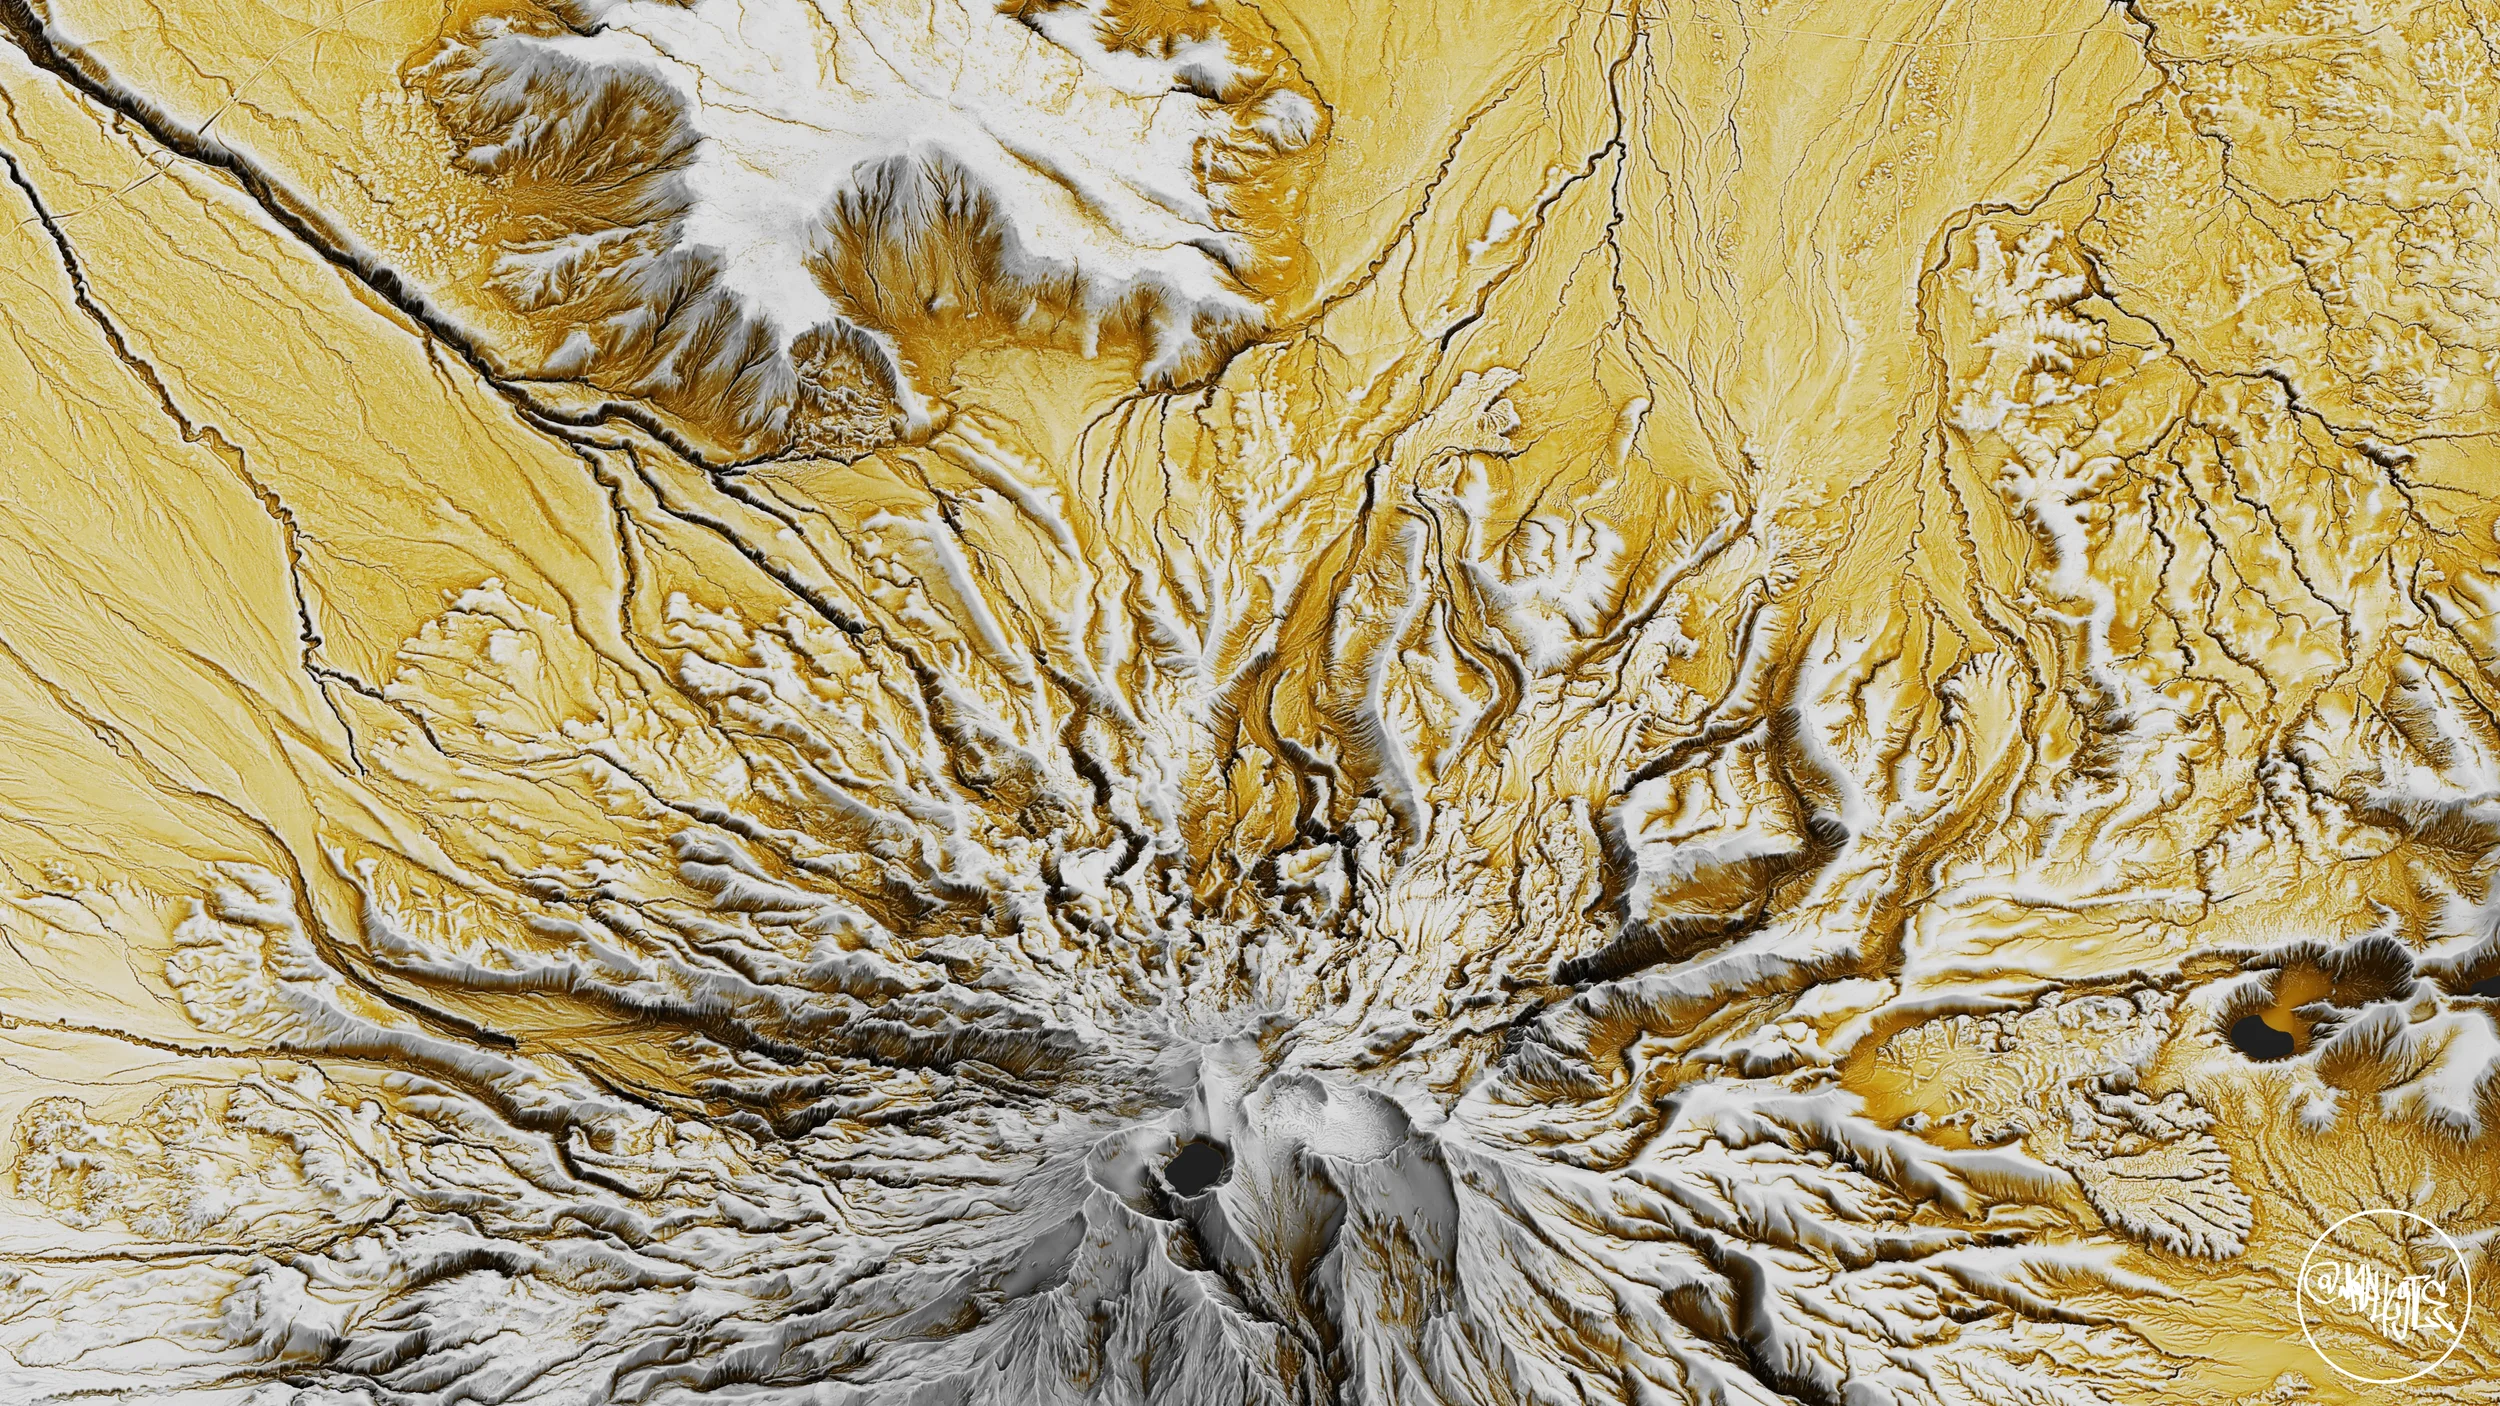
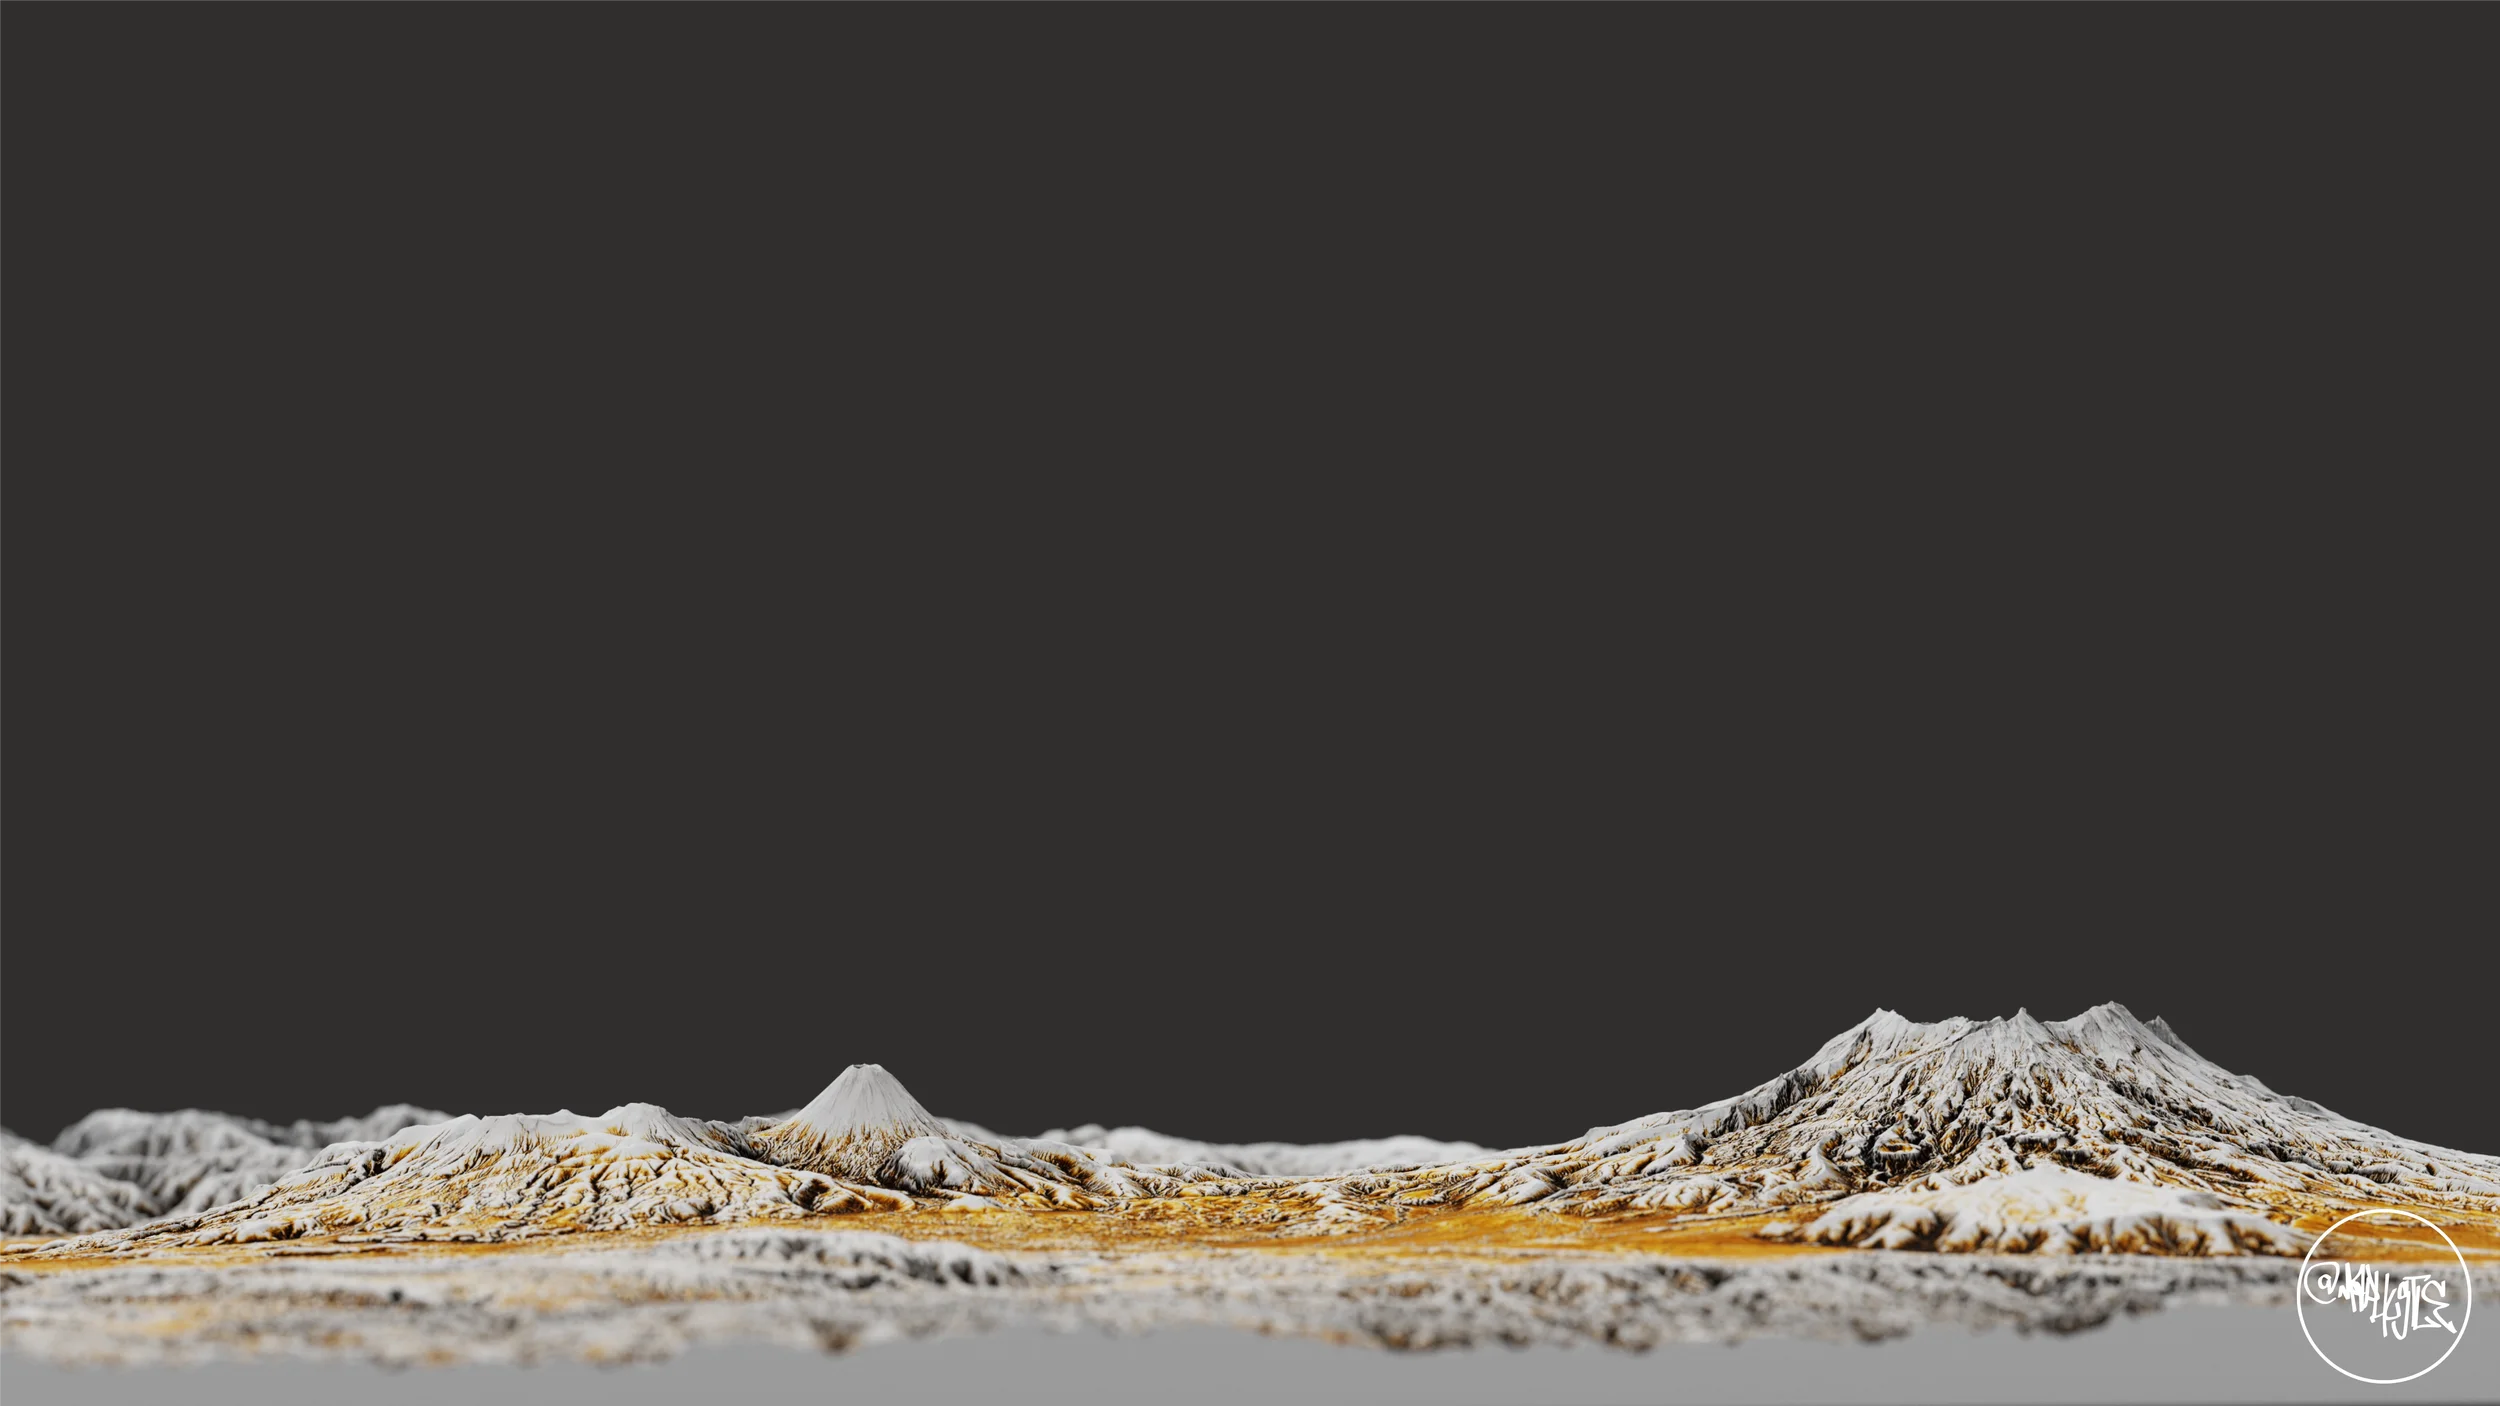
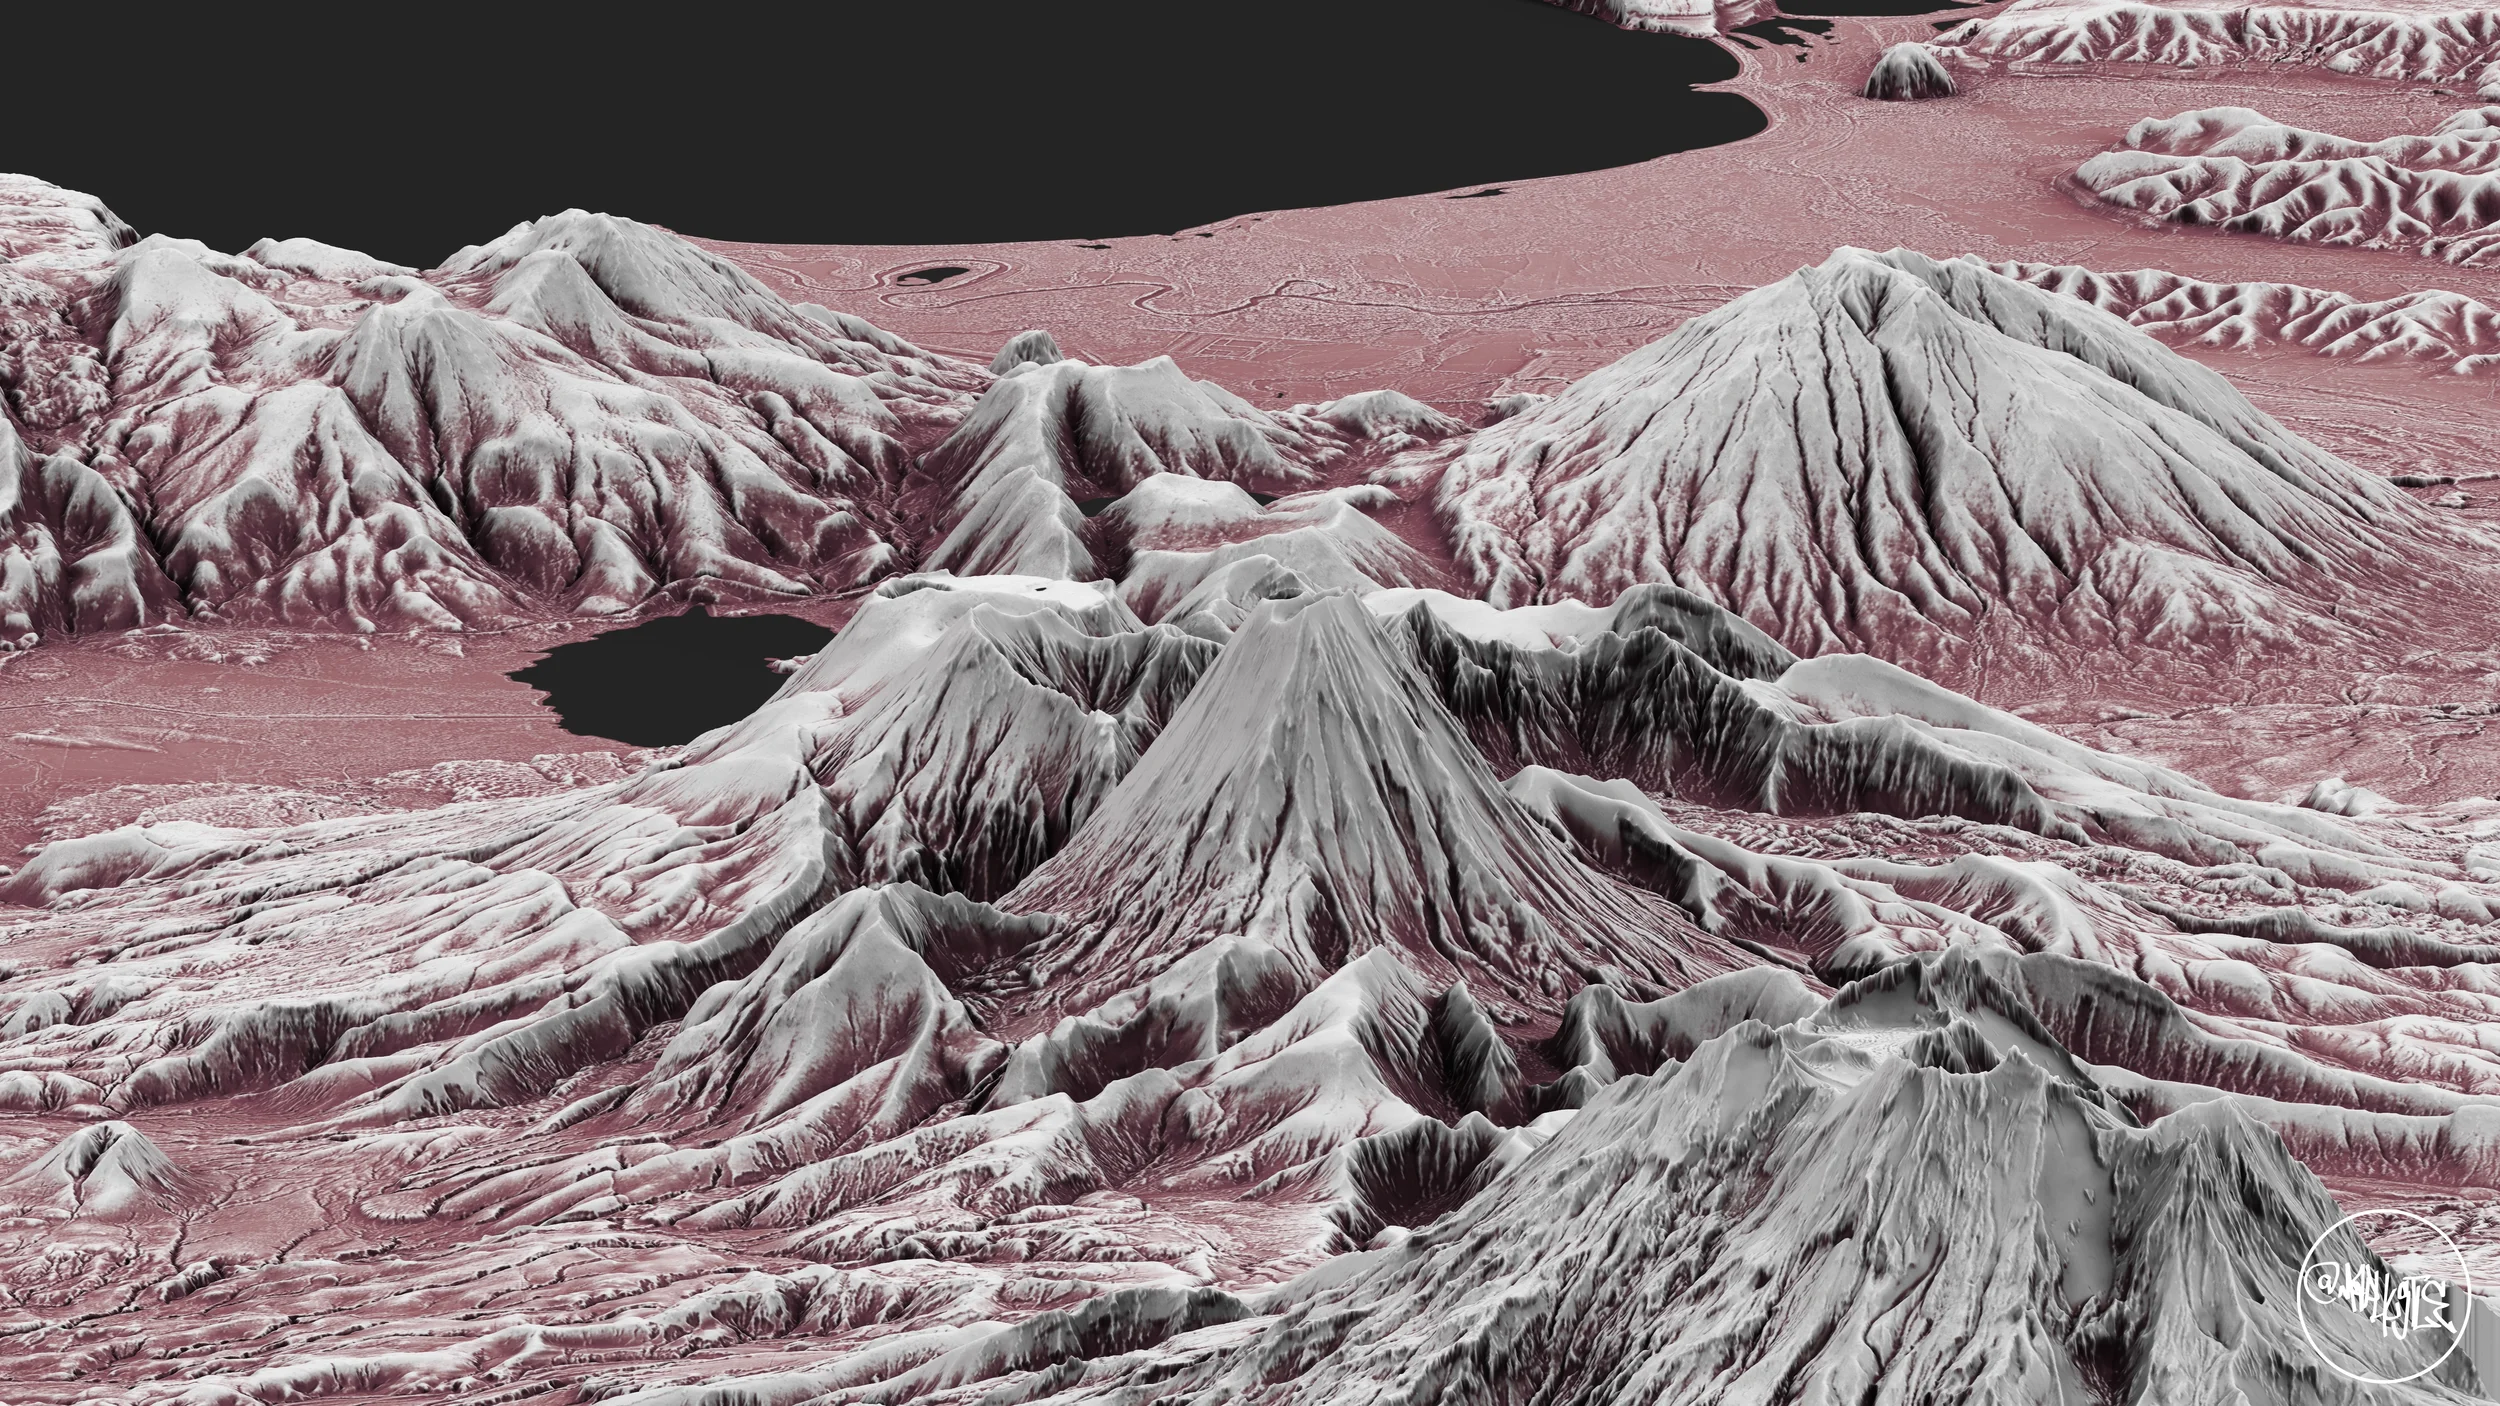
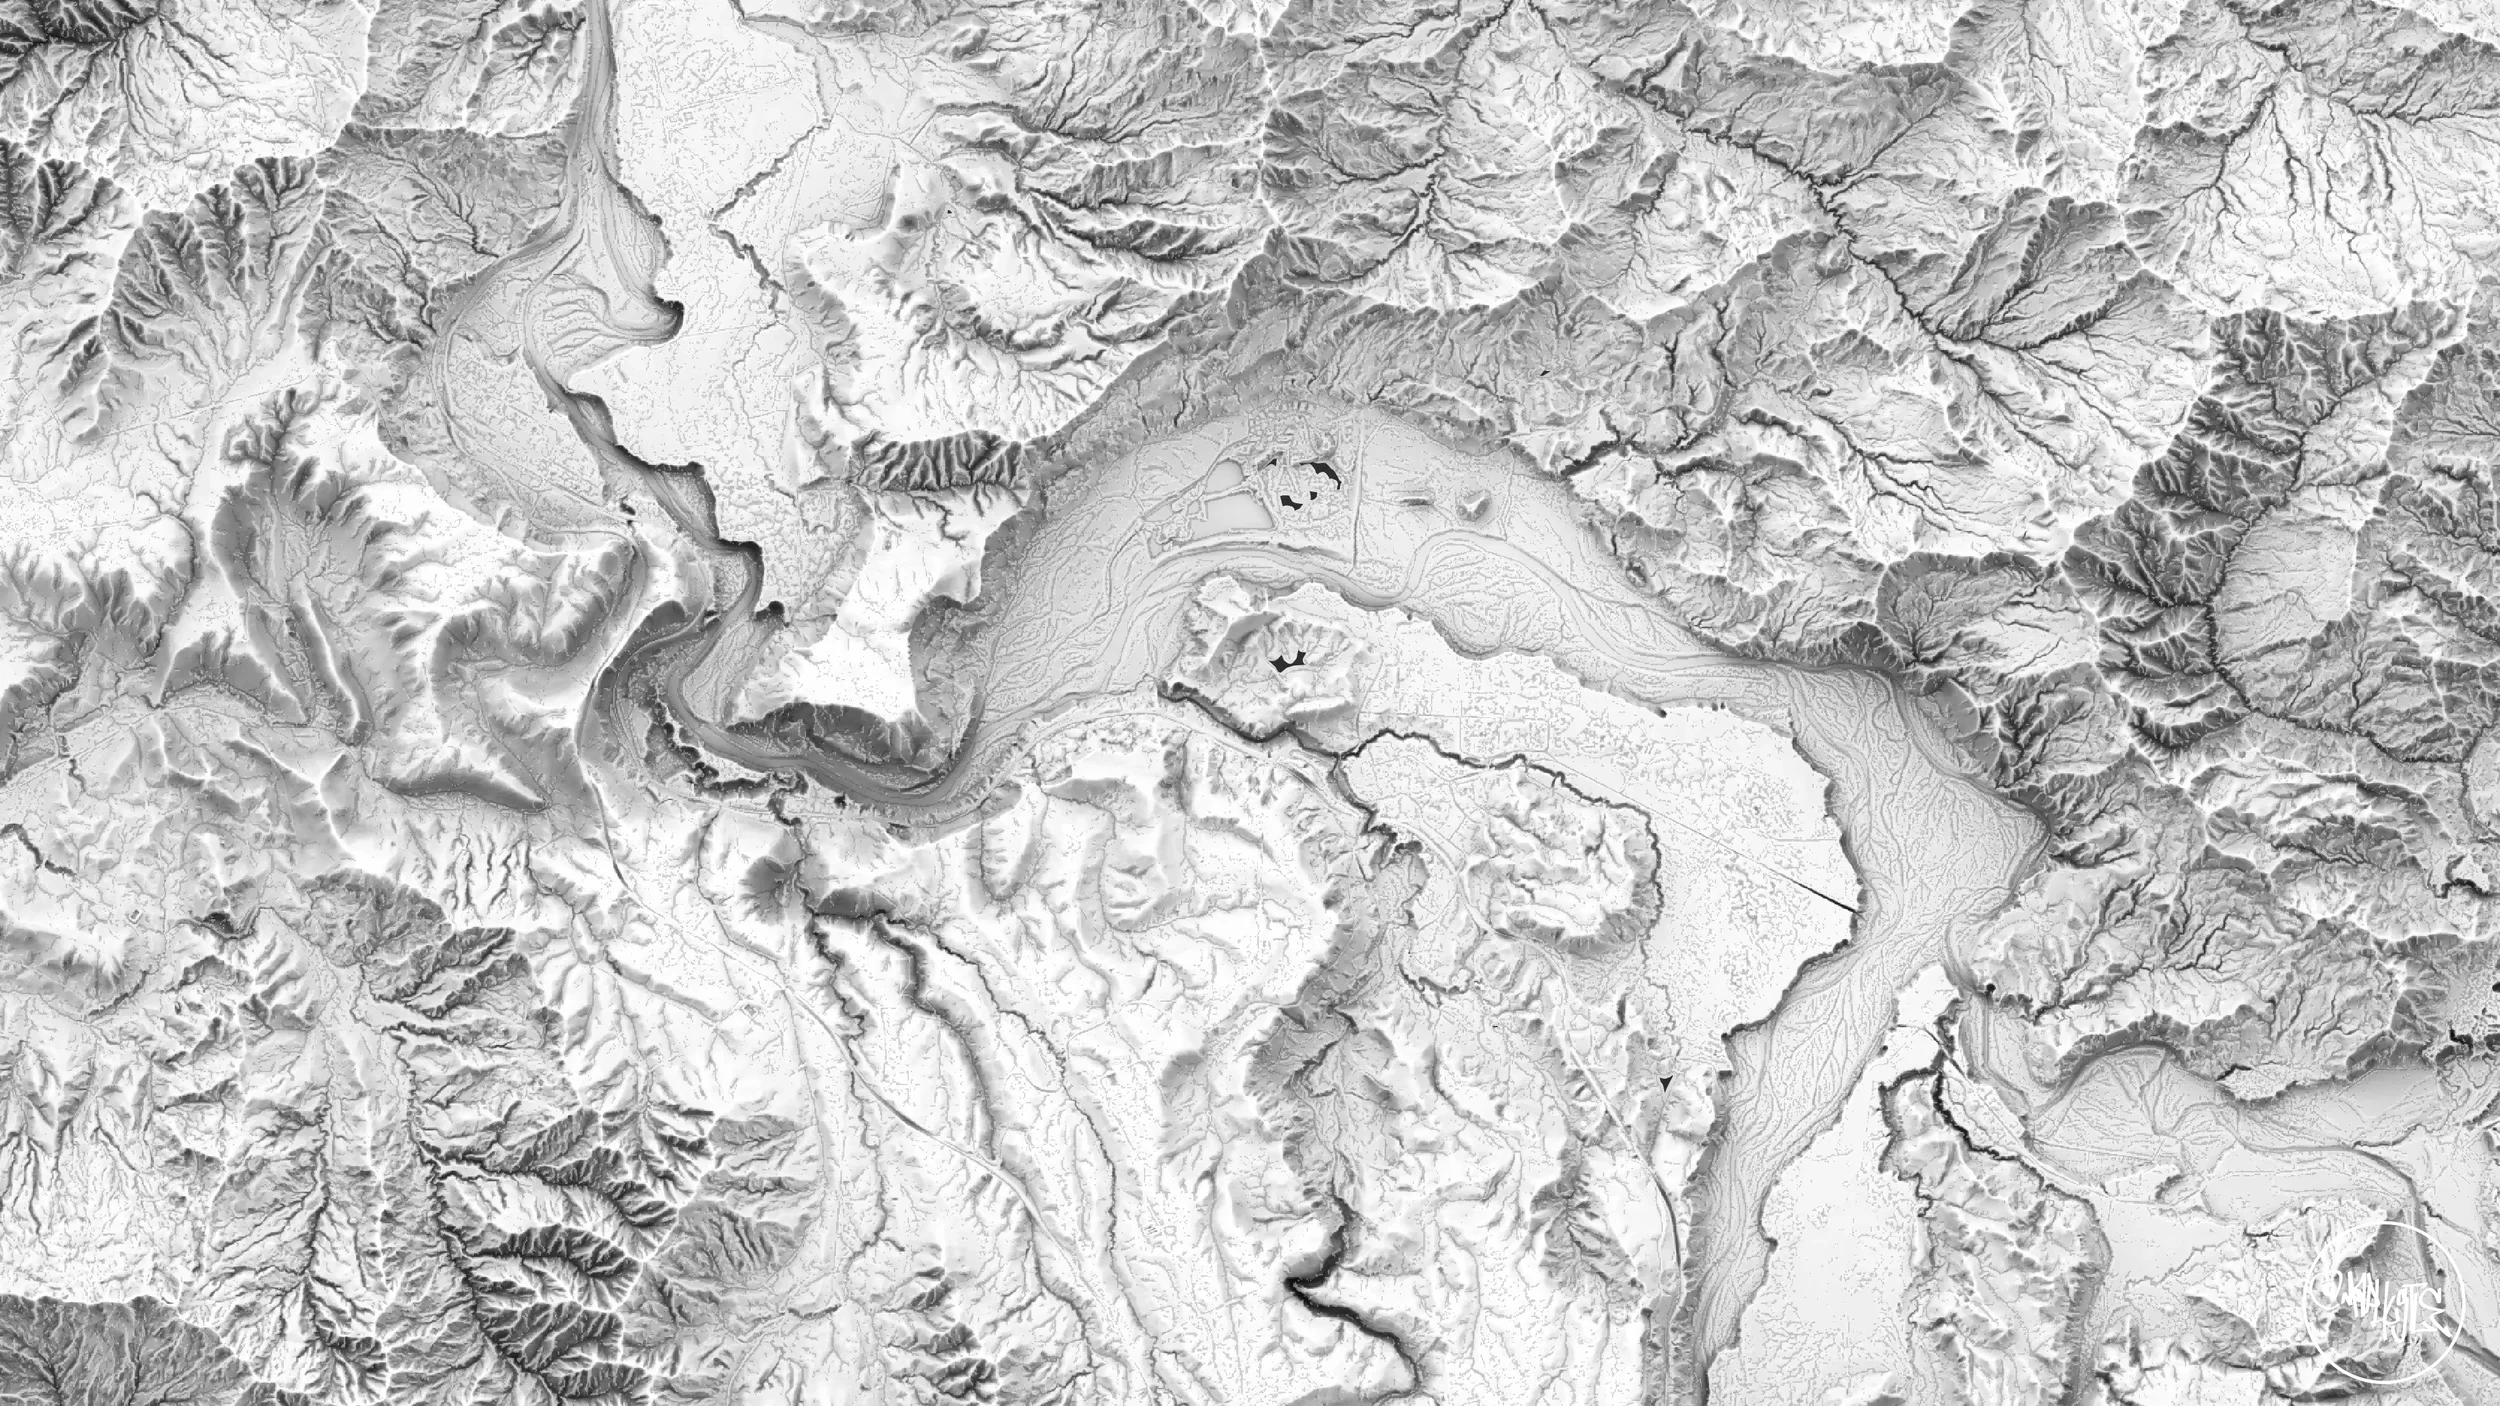
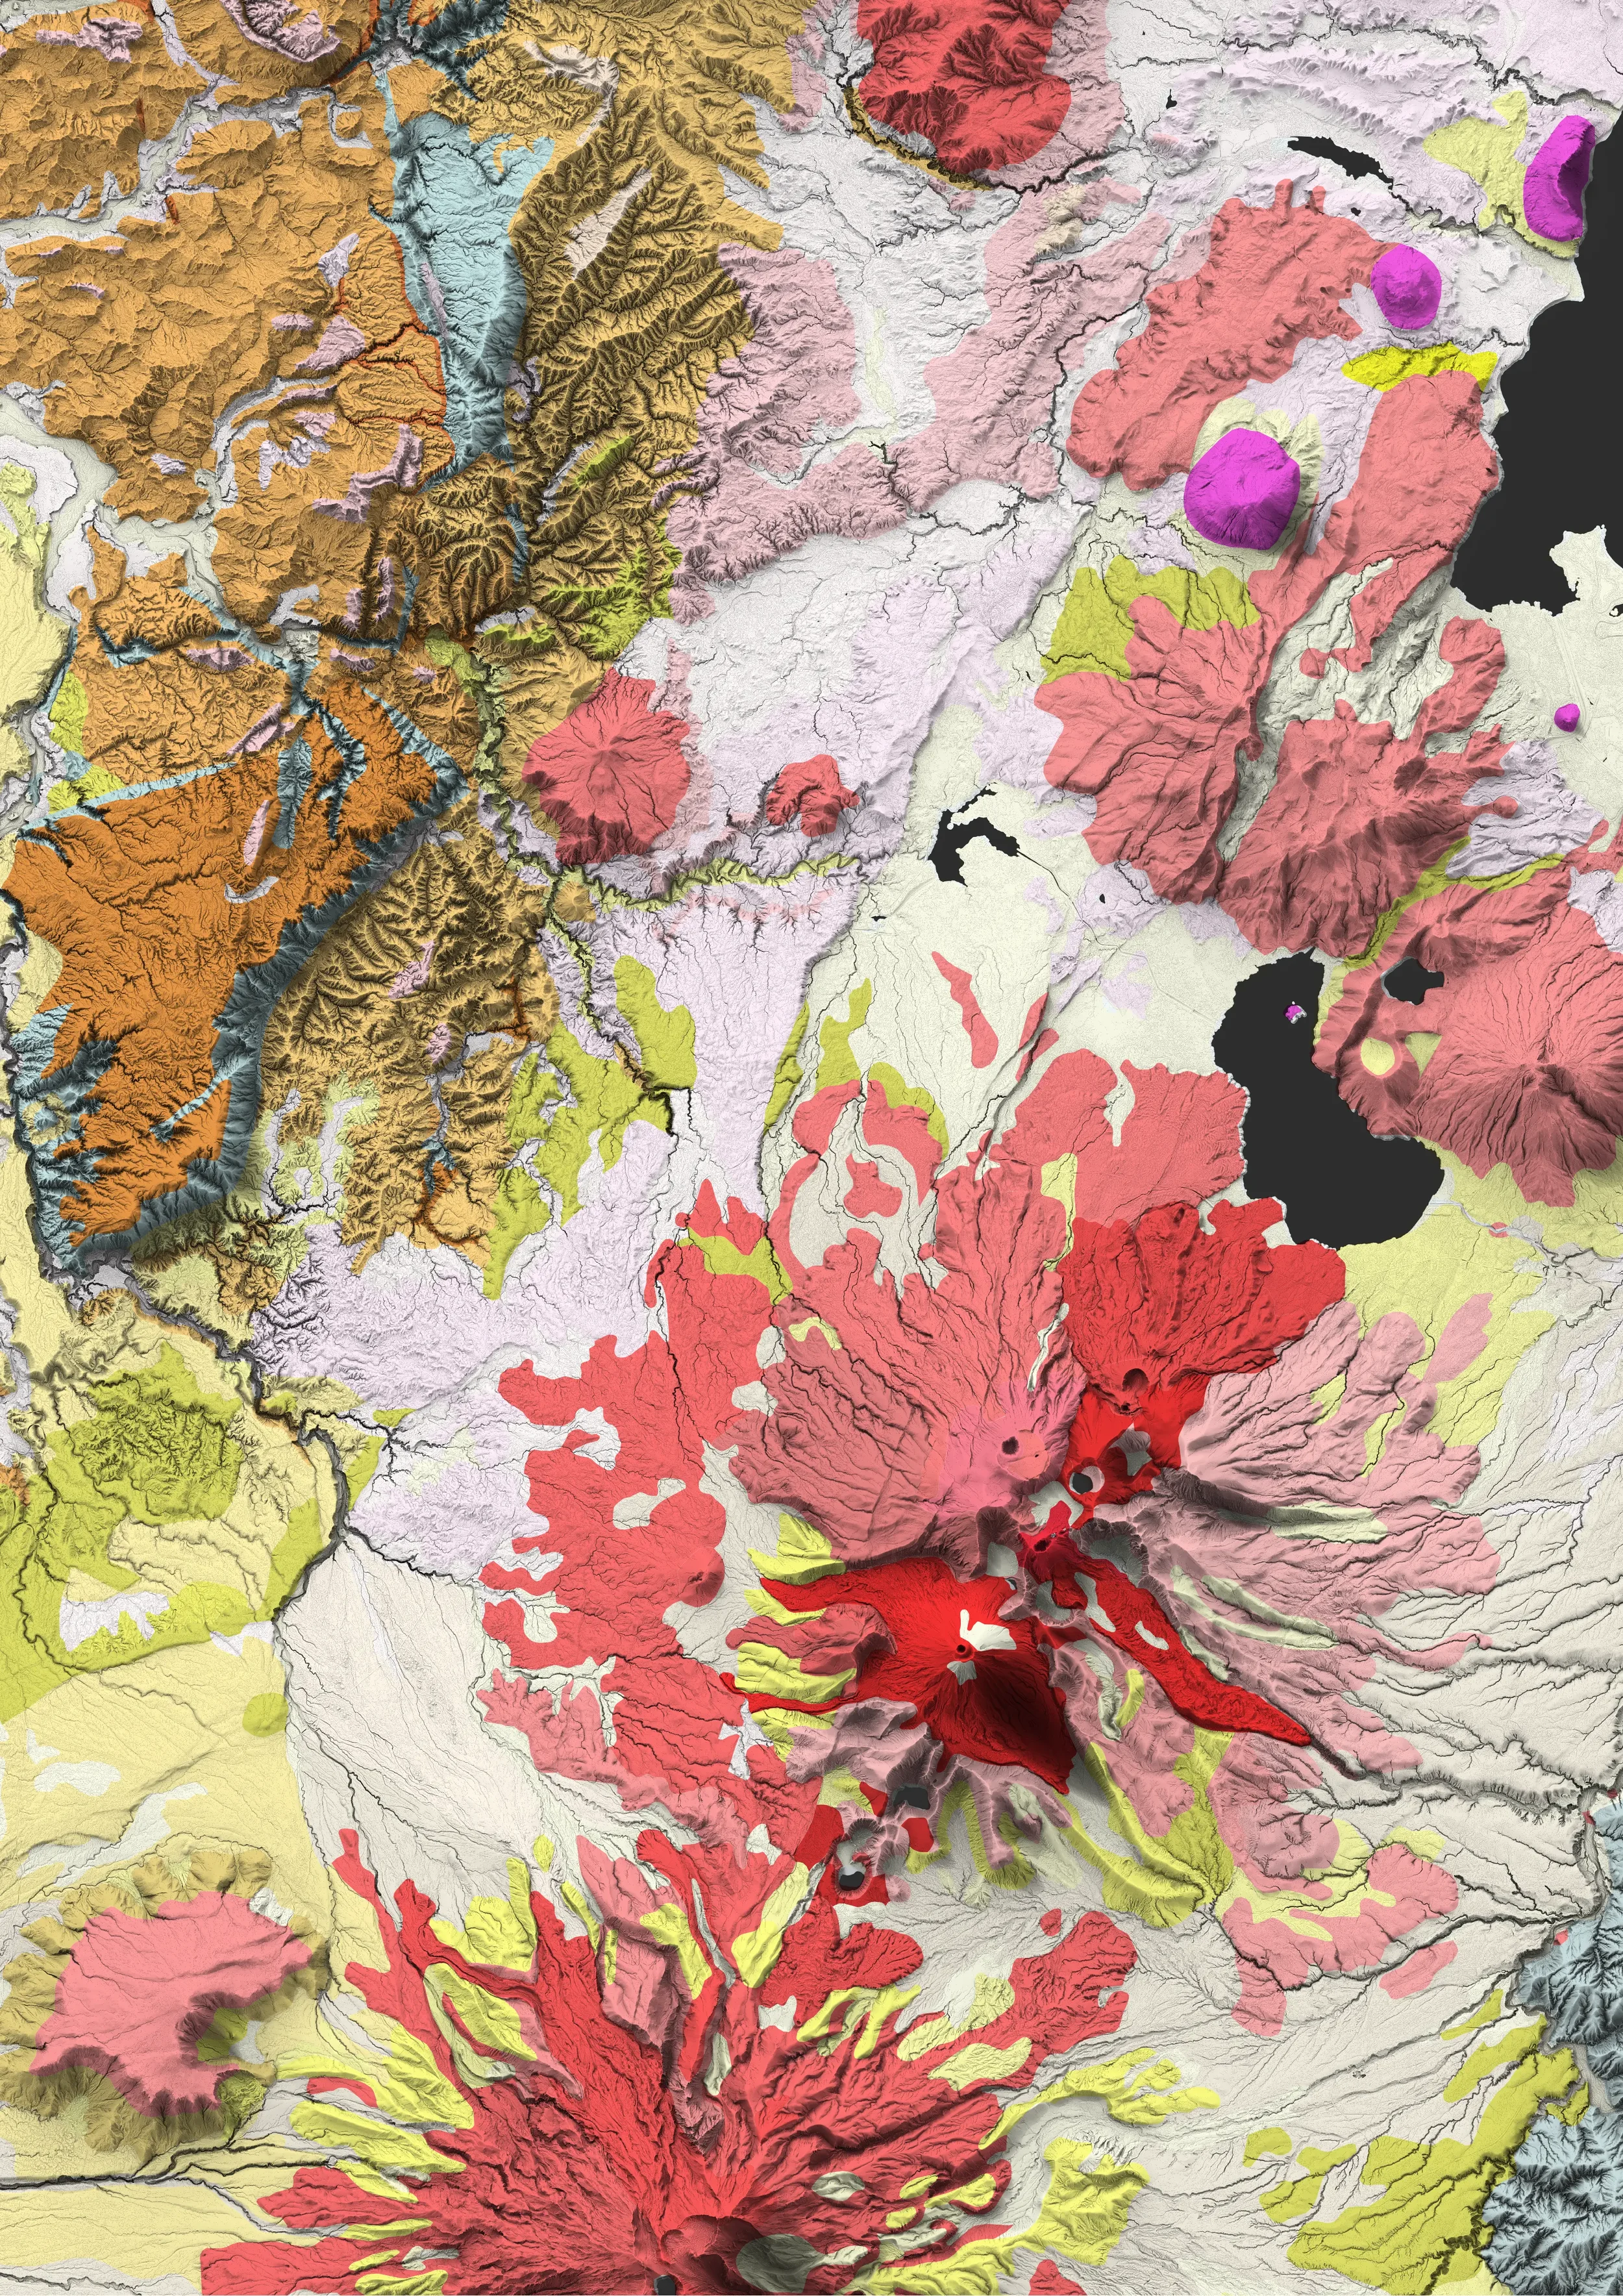
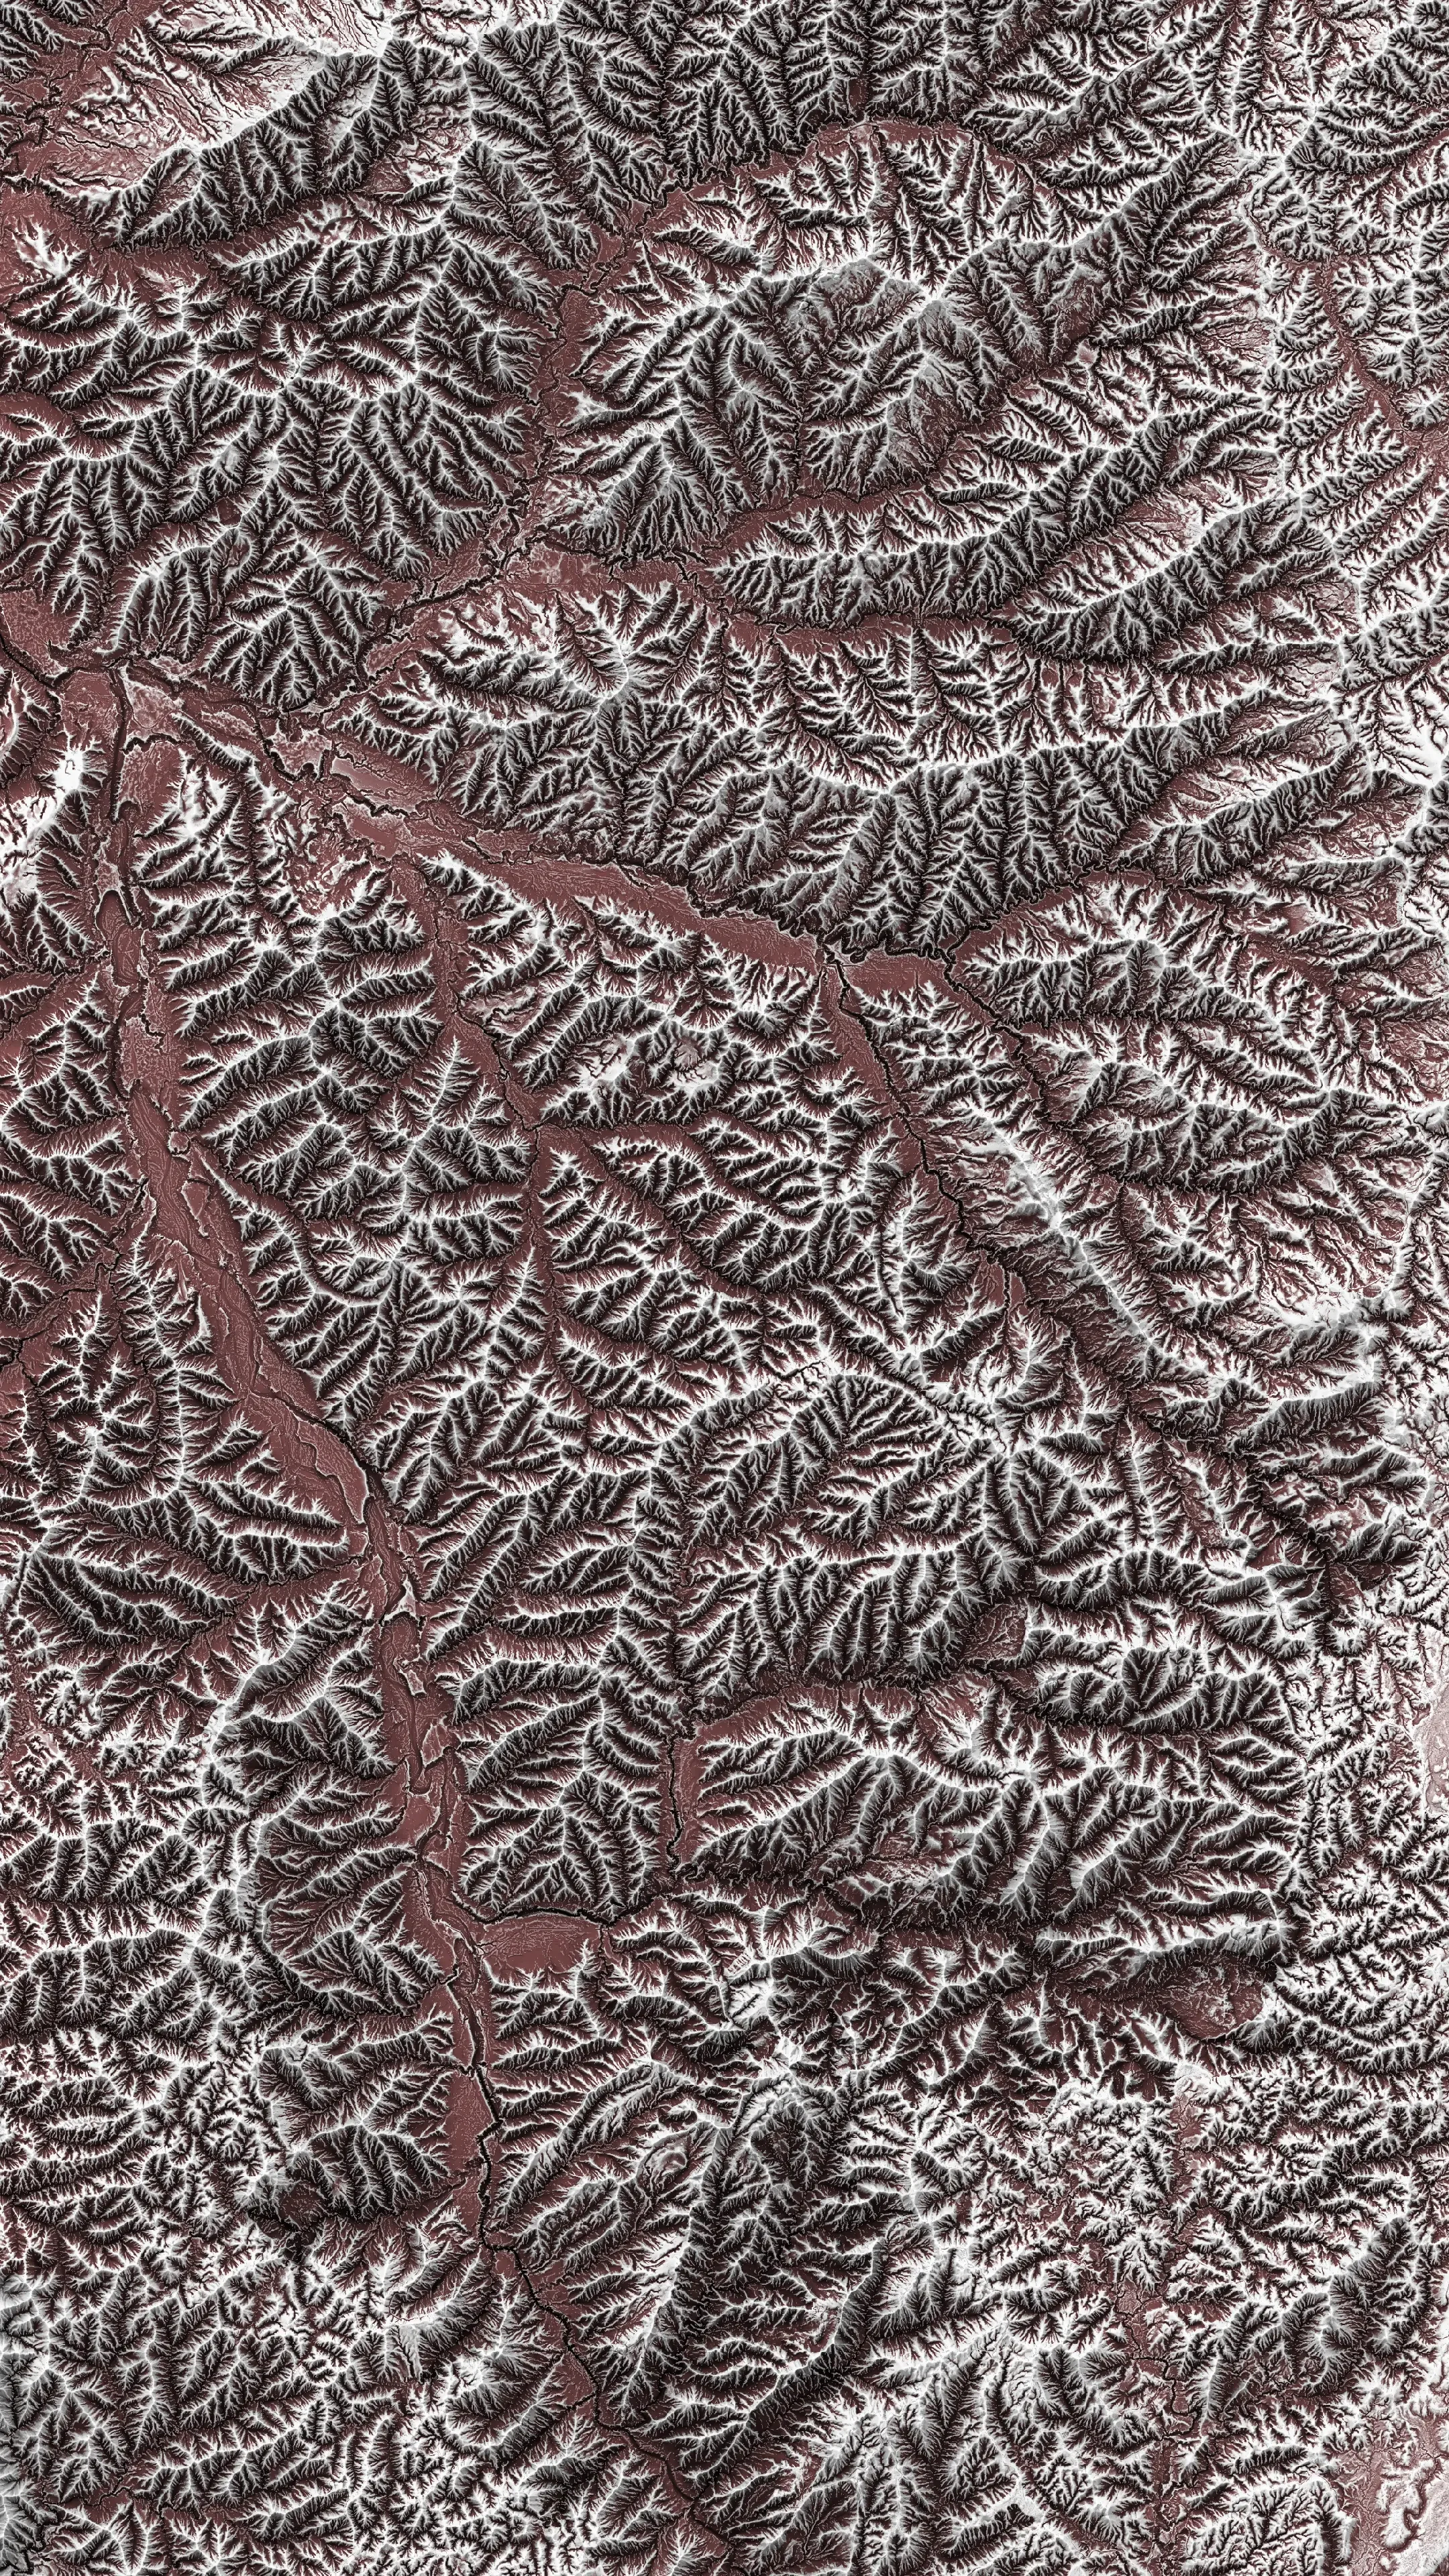
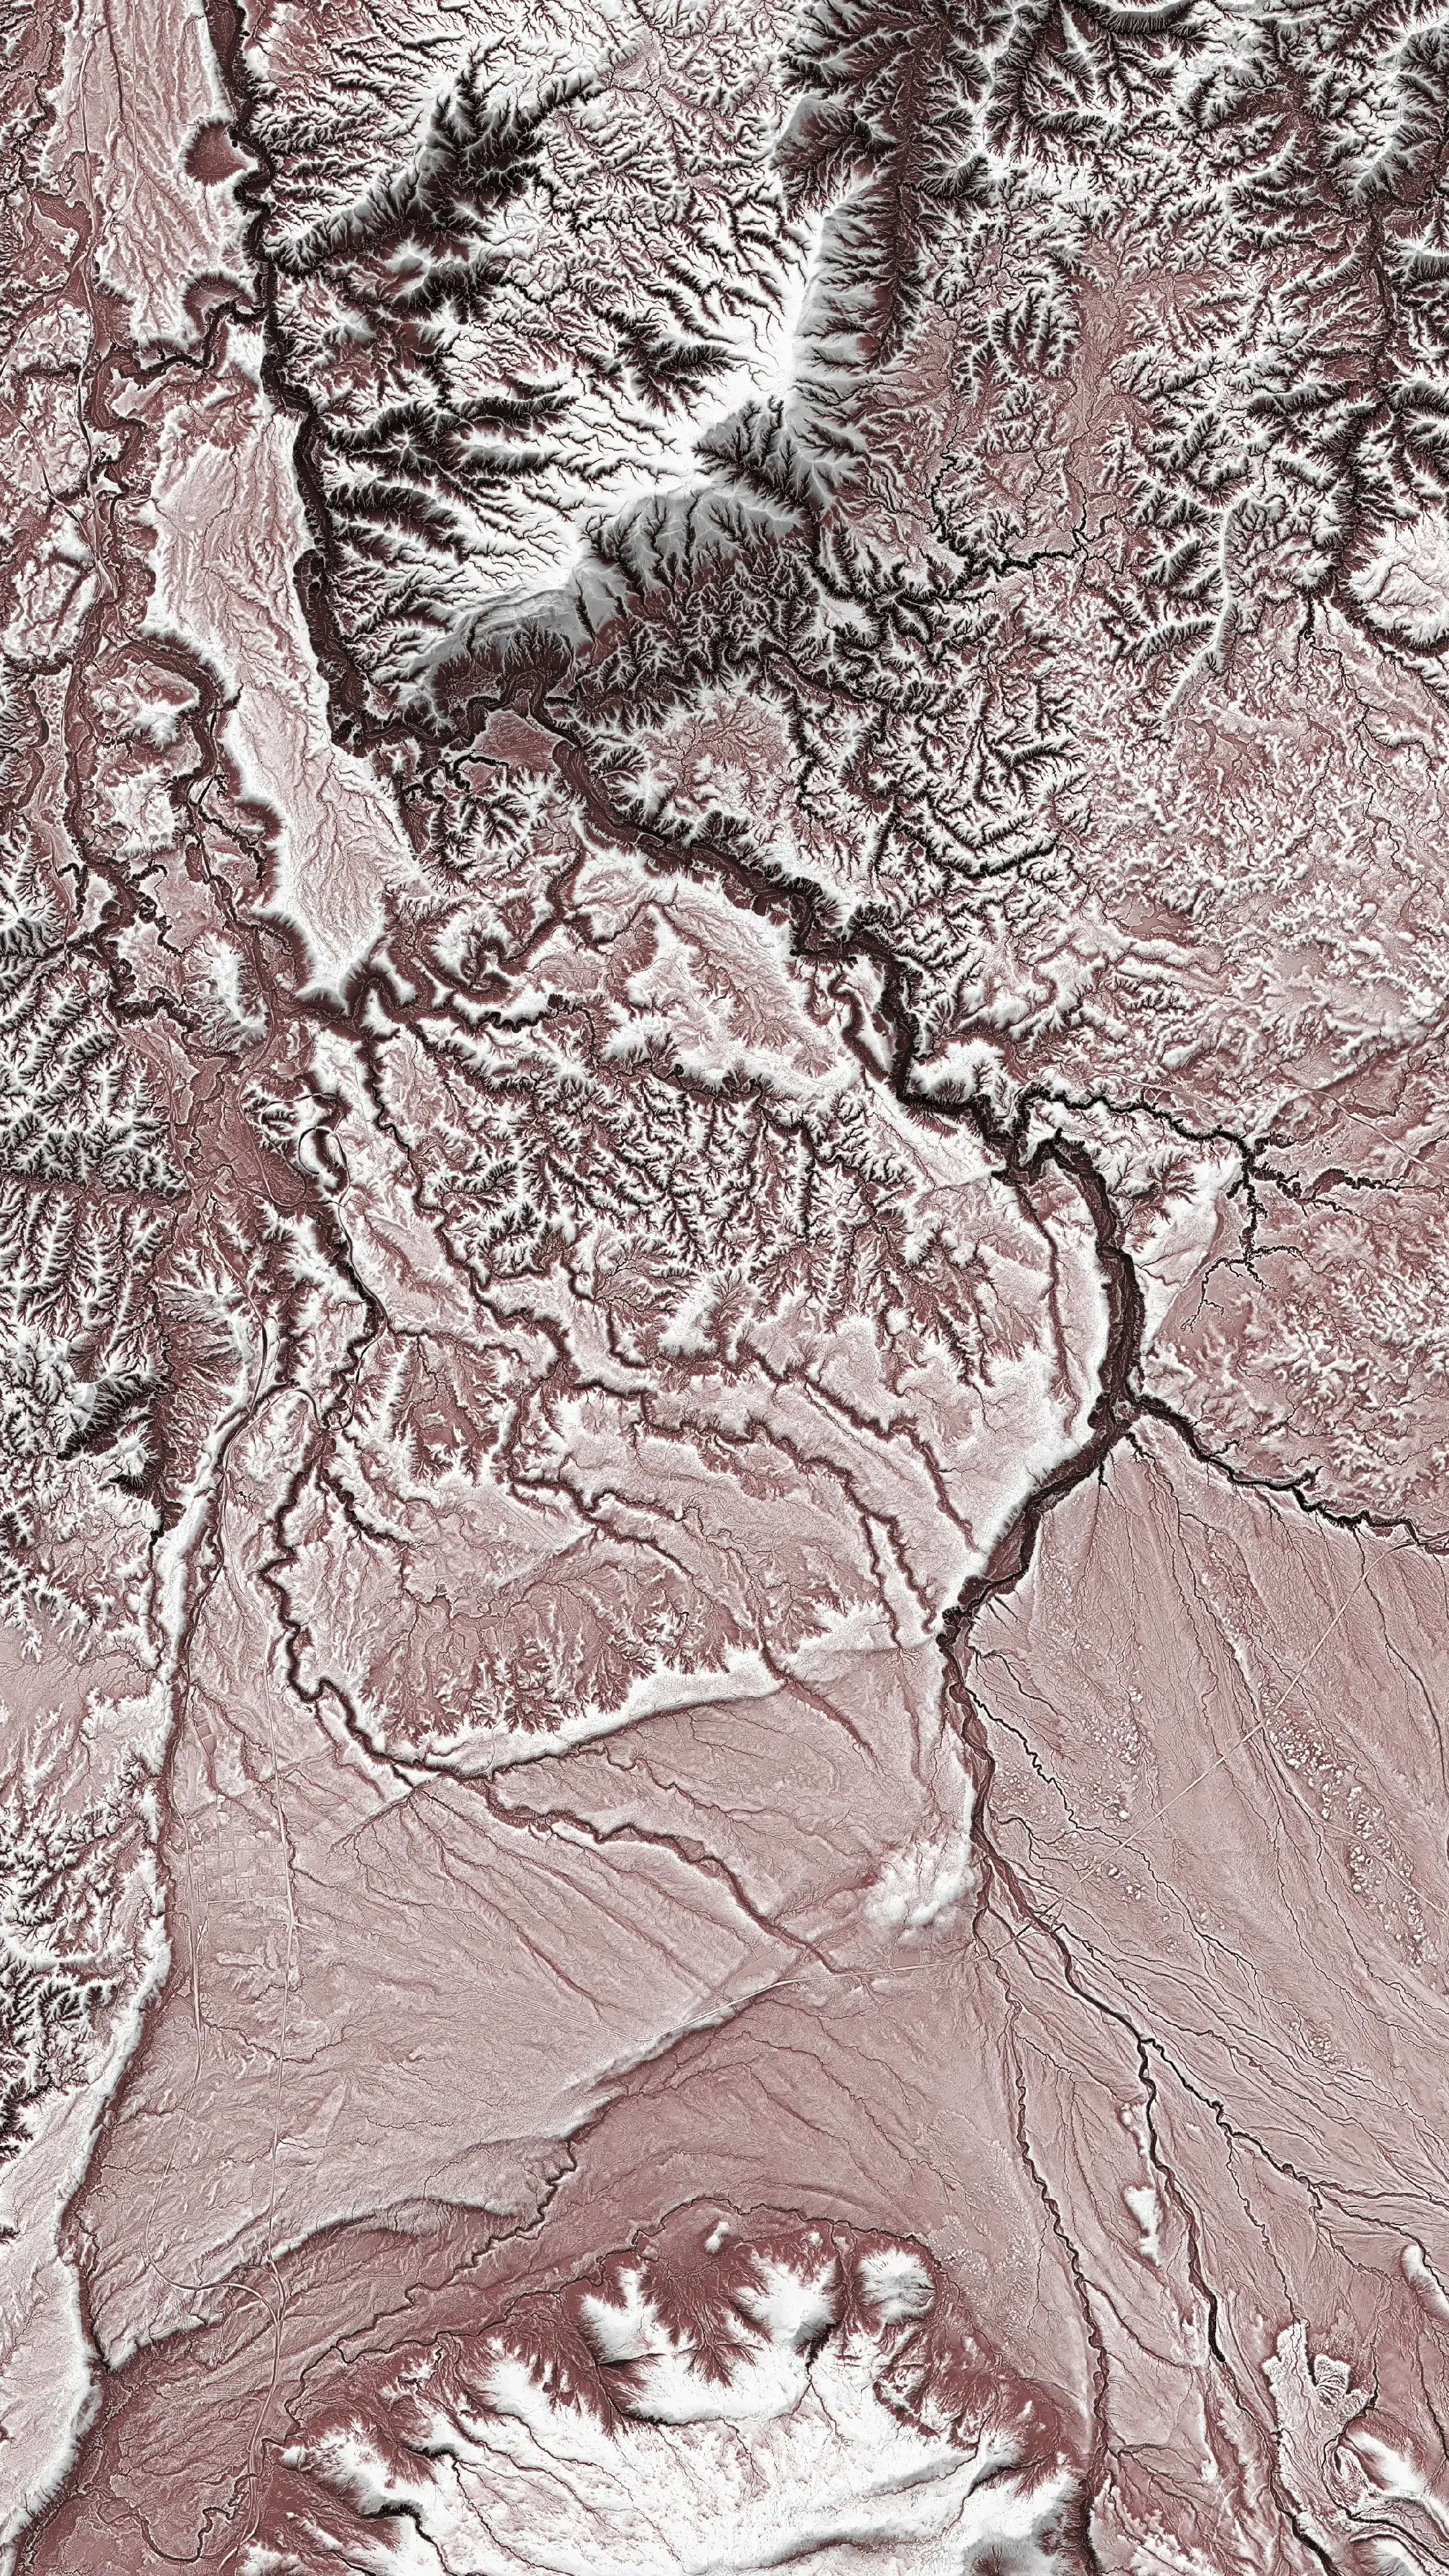
Tongariro Volcanic Zone
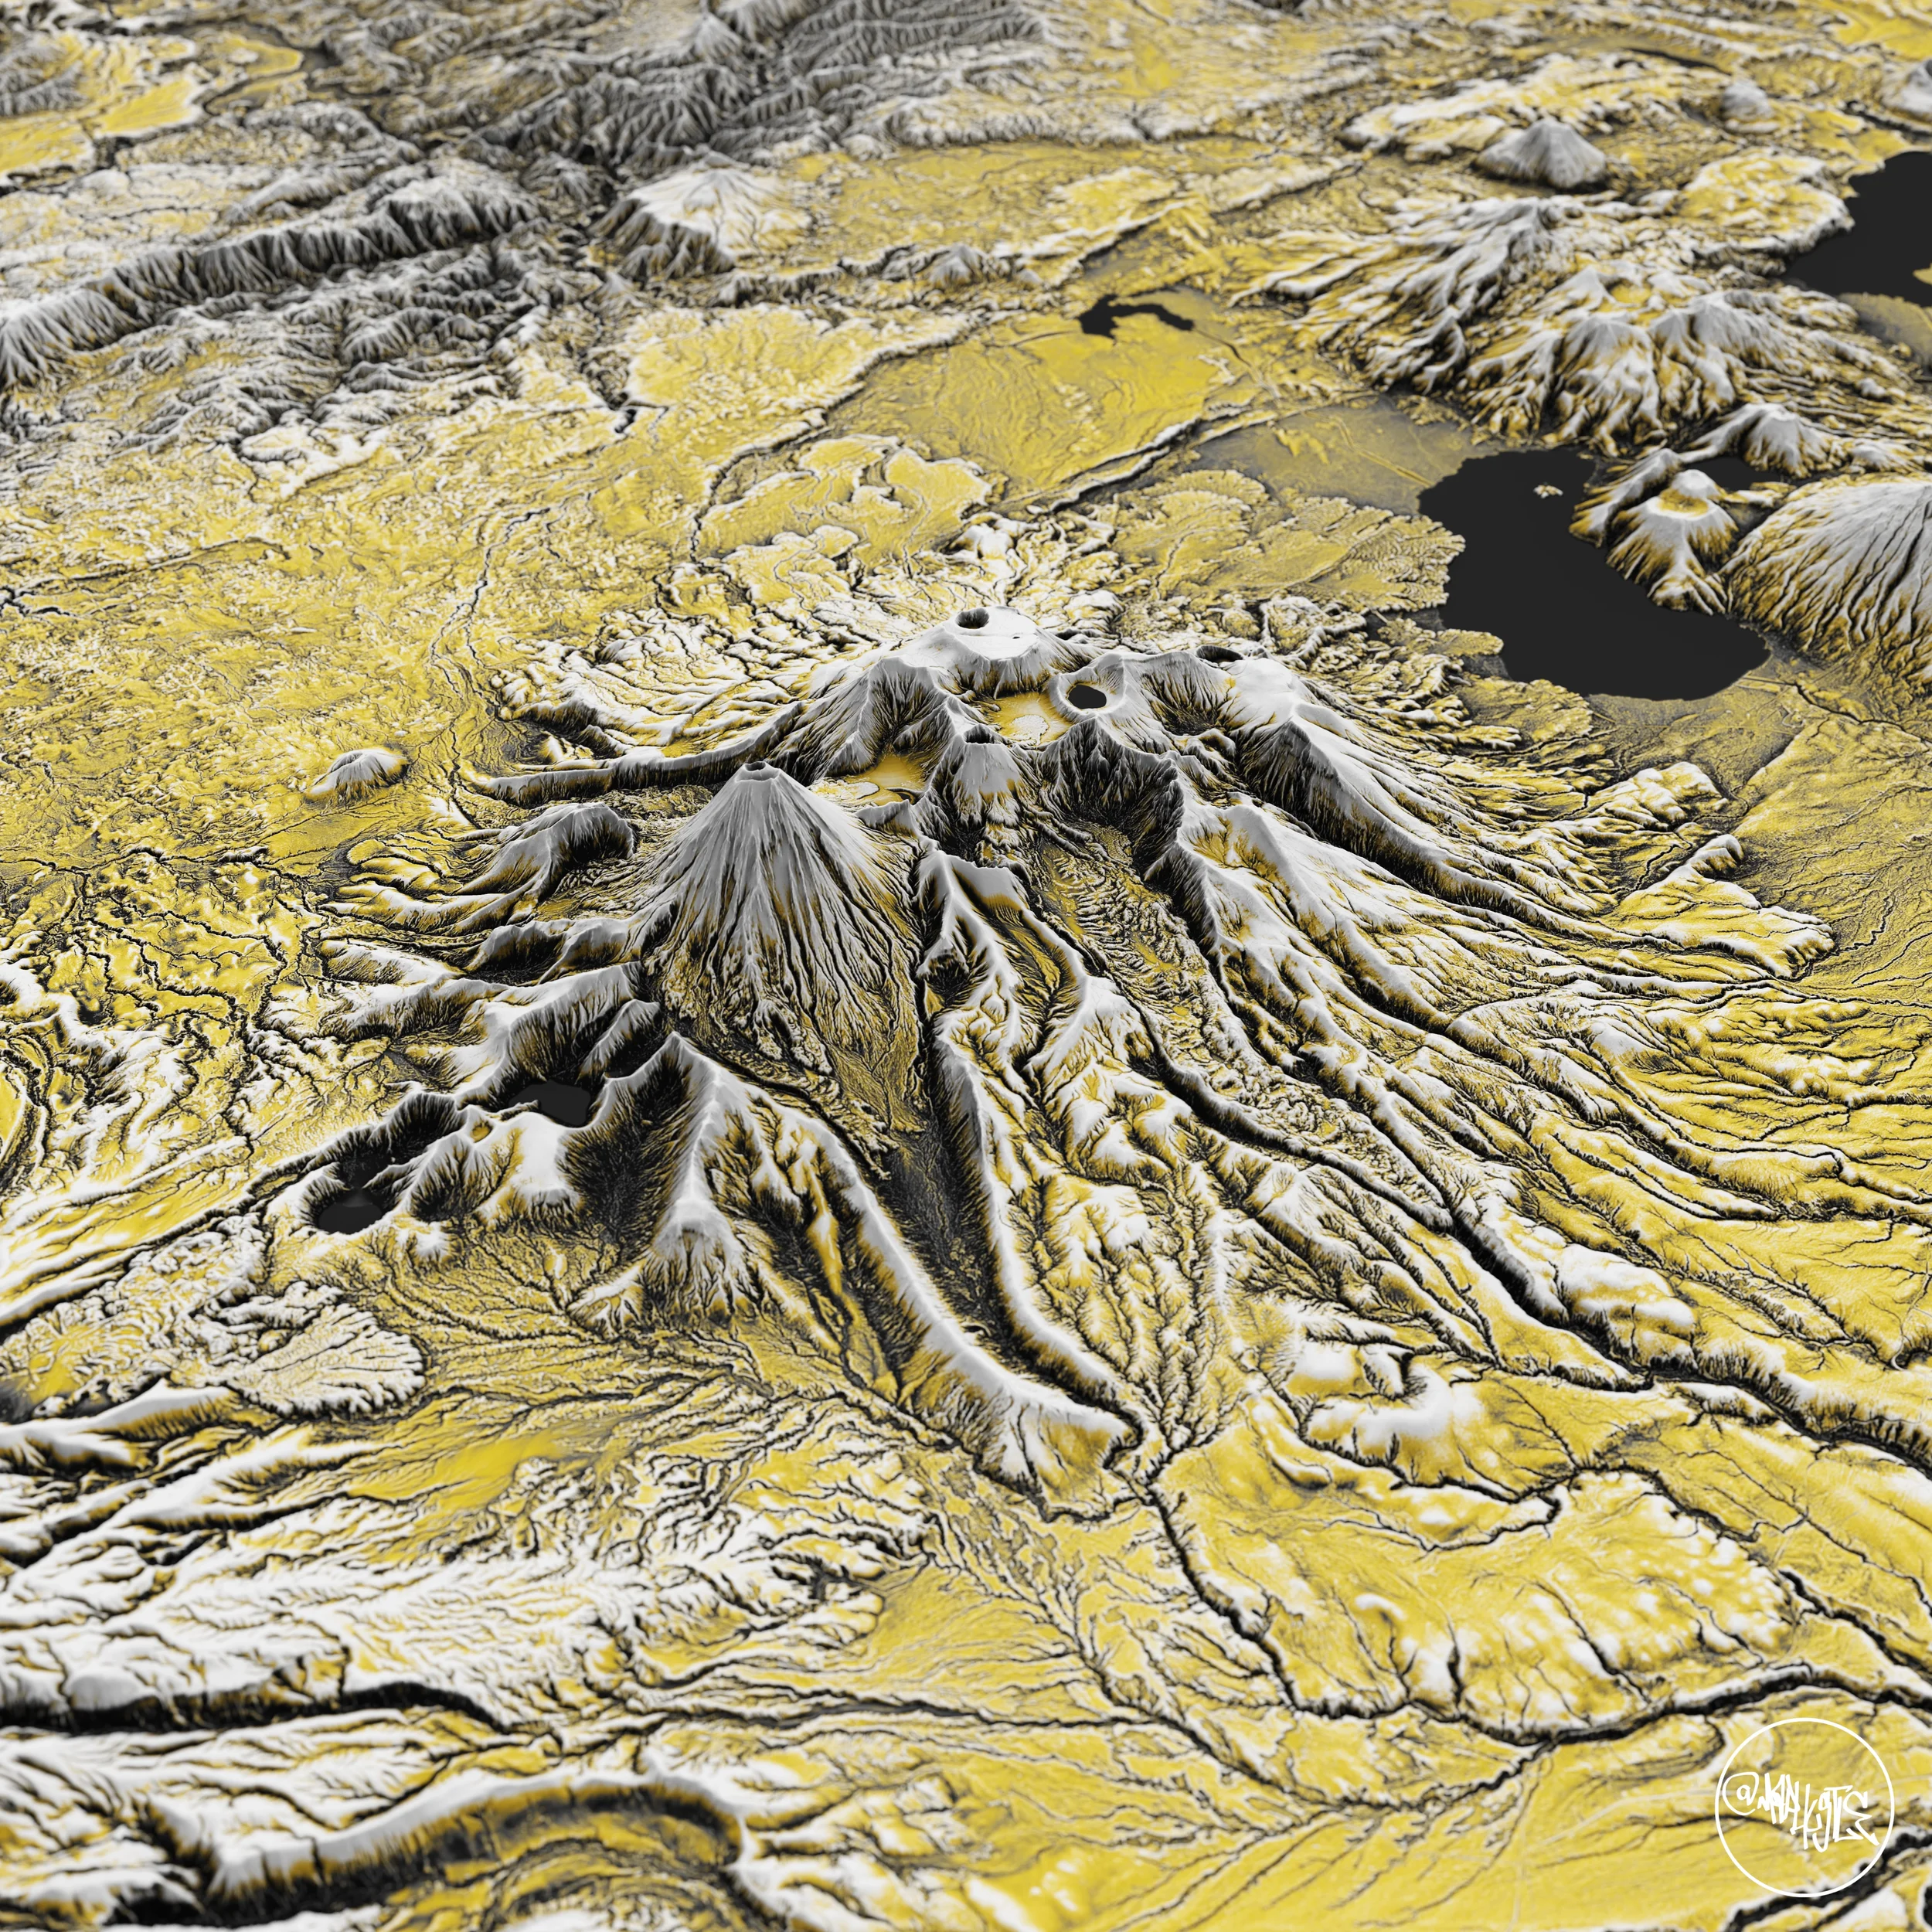
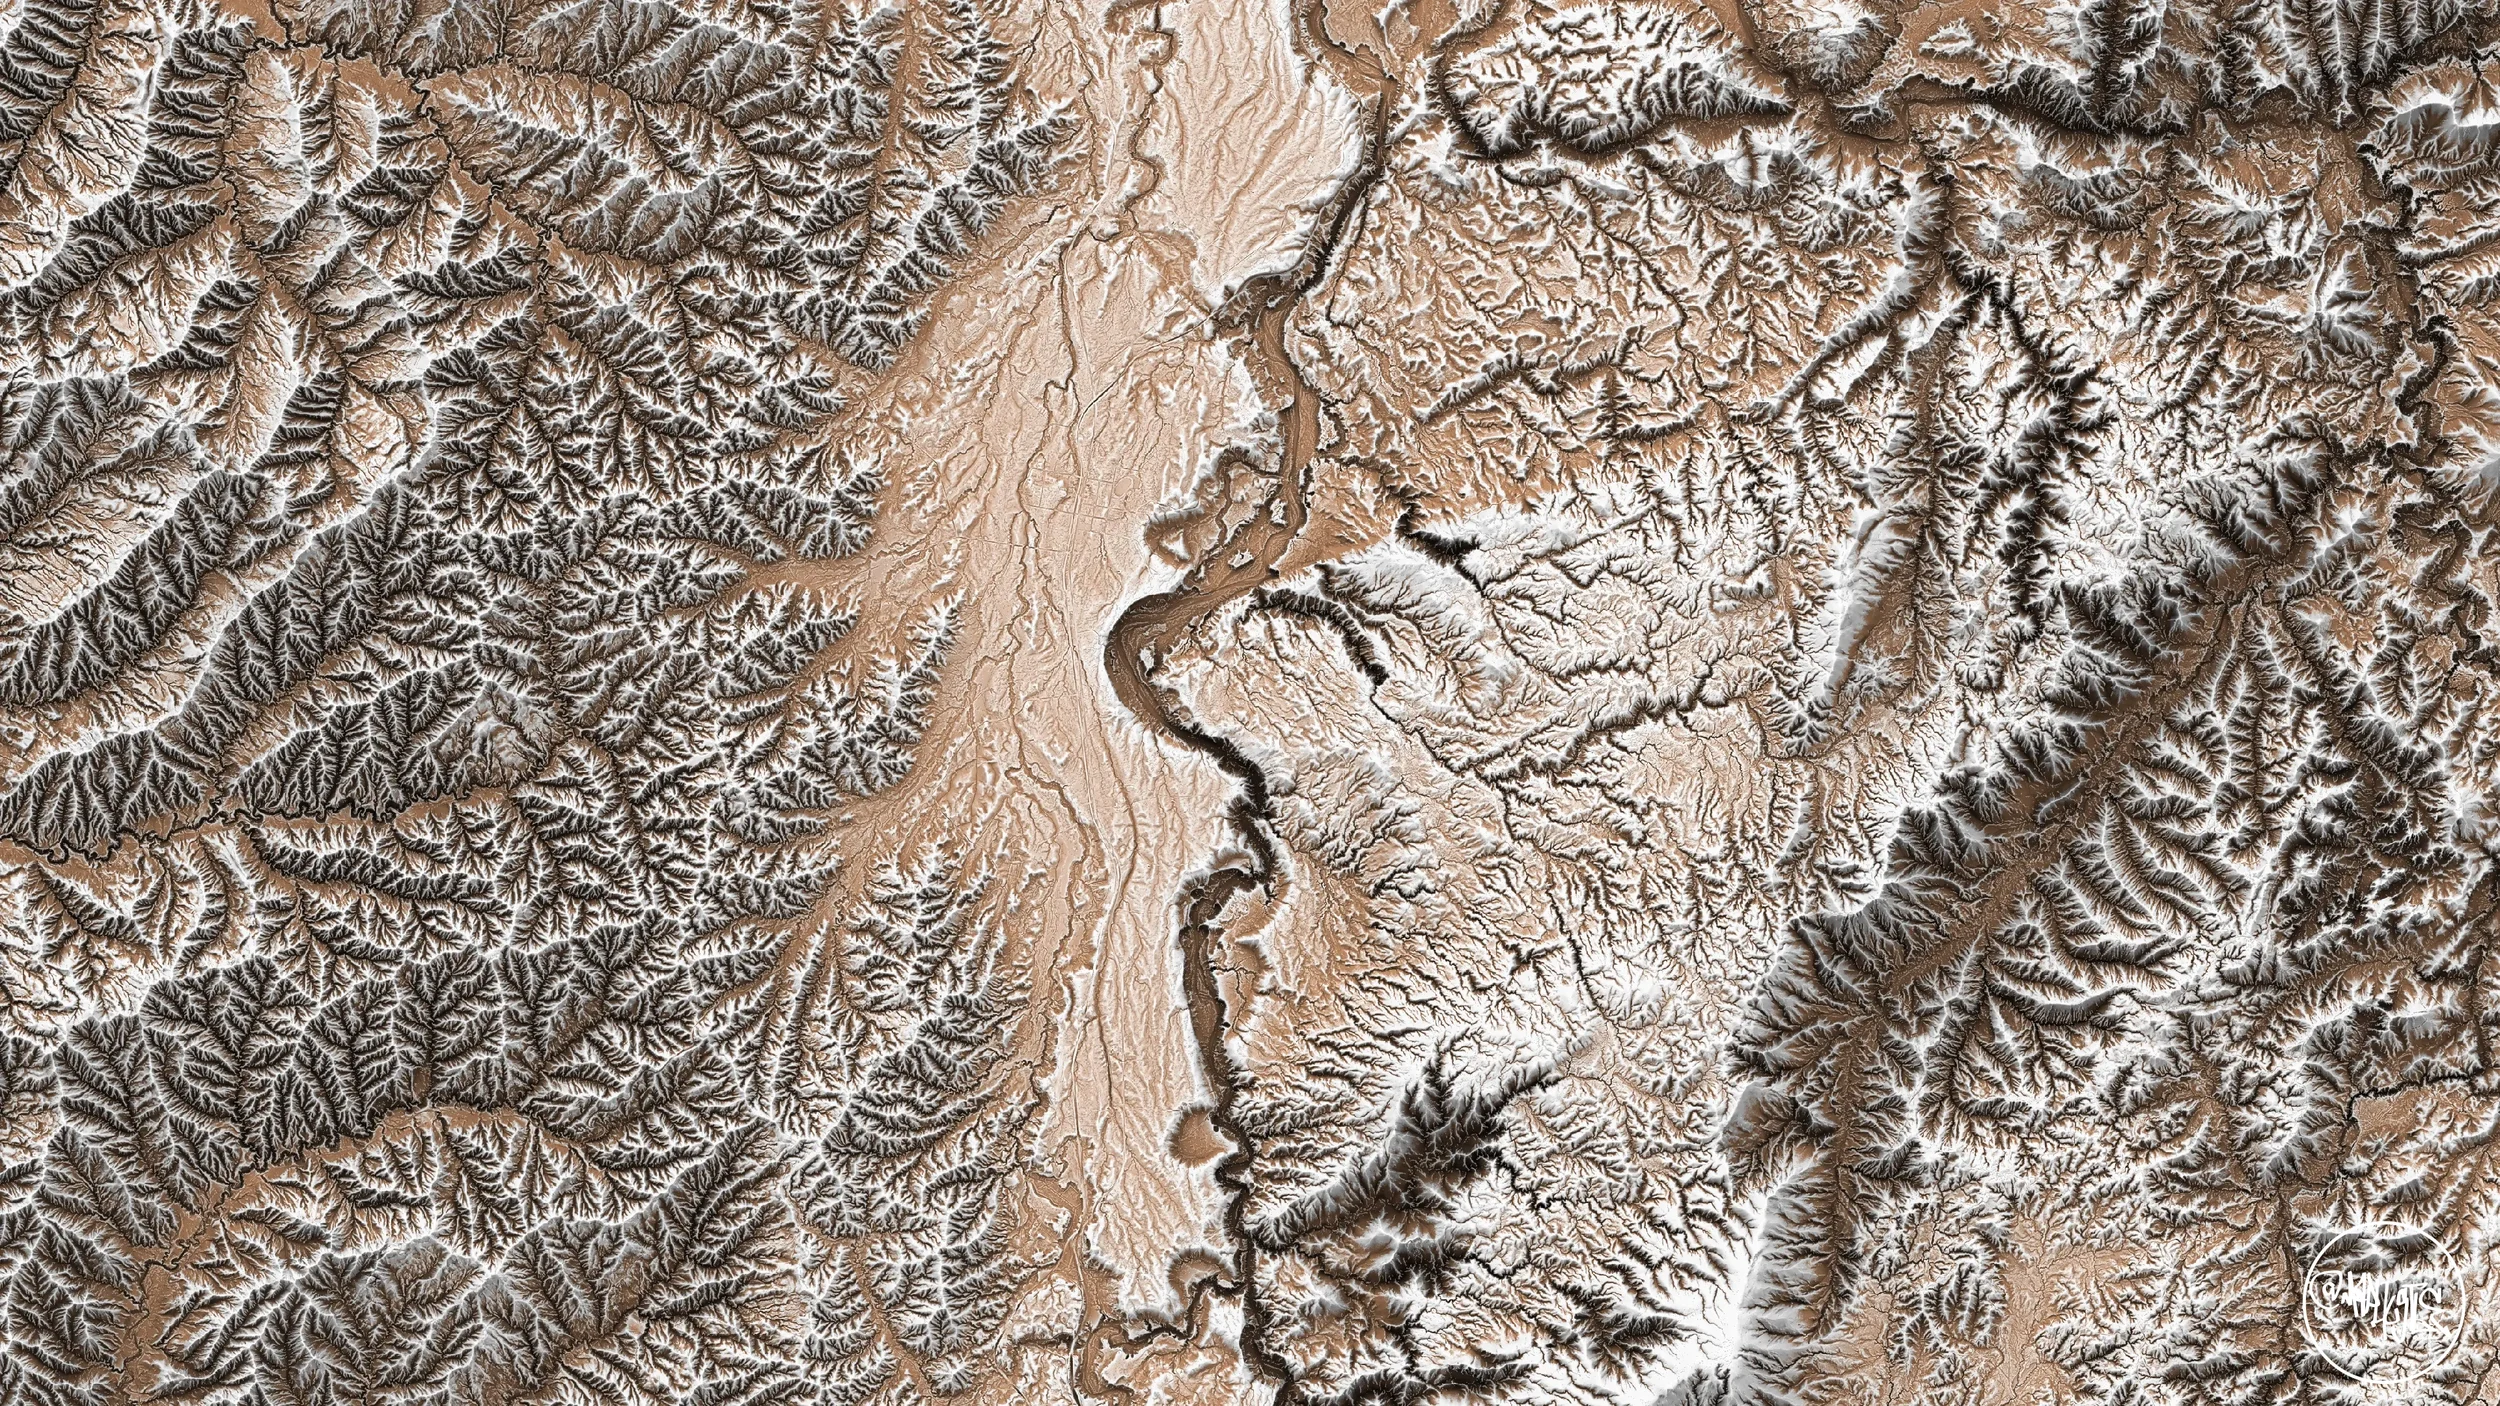
Here are the colour schemes that I settled on. I have taken inspiration from a popular video game named Elden Ring. There’s nothing to this other than creative expression, so I shan’t go into any further detail. Please note, there is a slight vertical exaggeration.
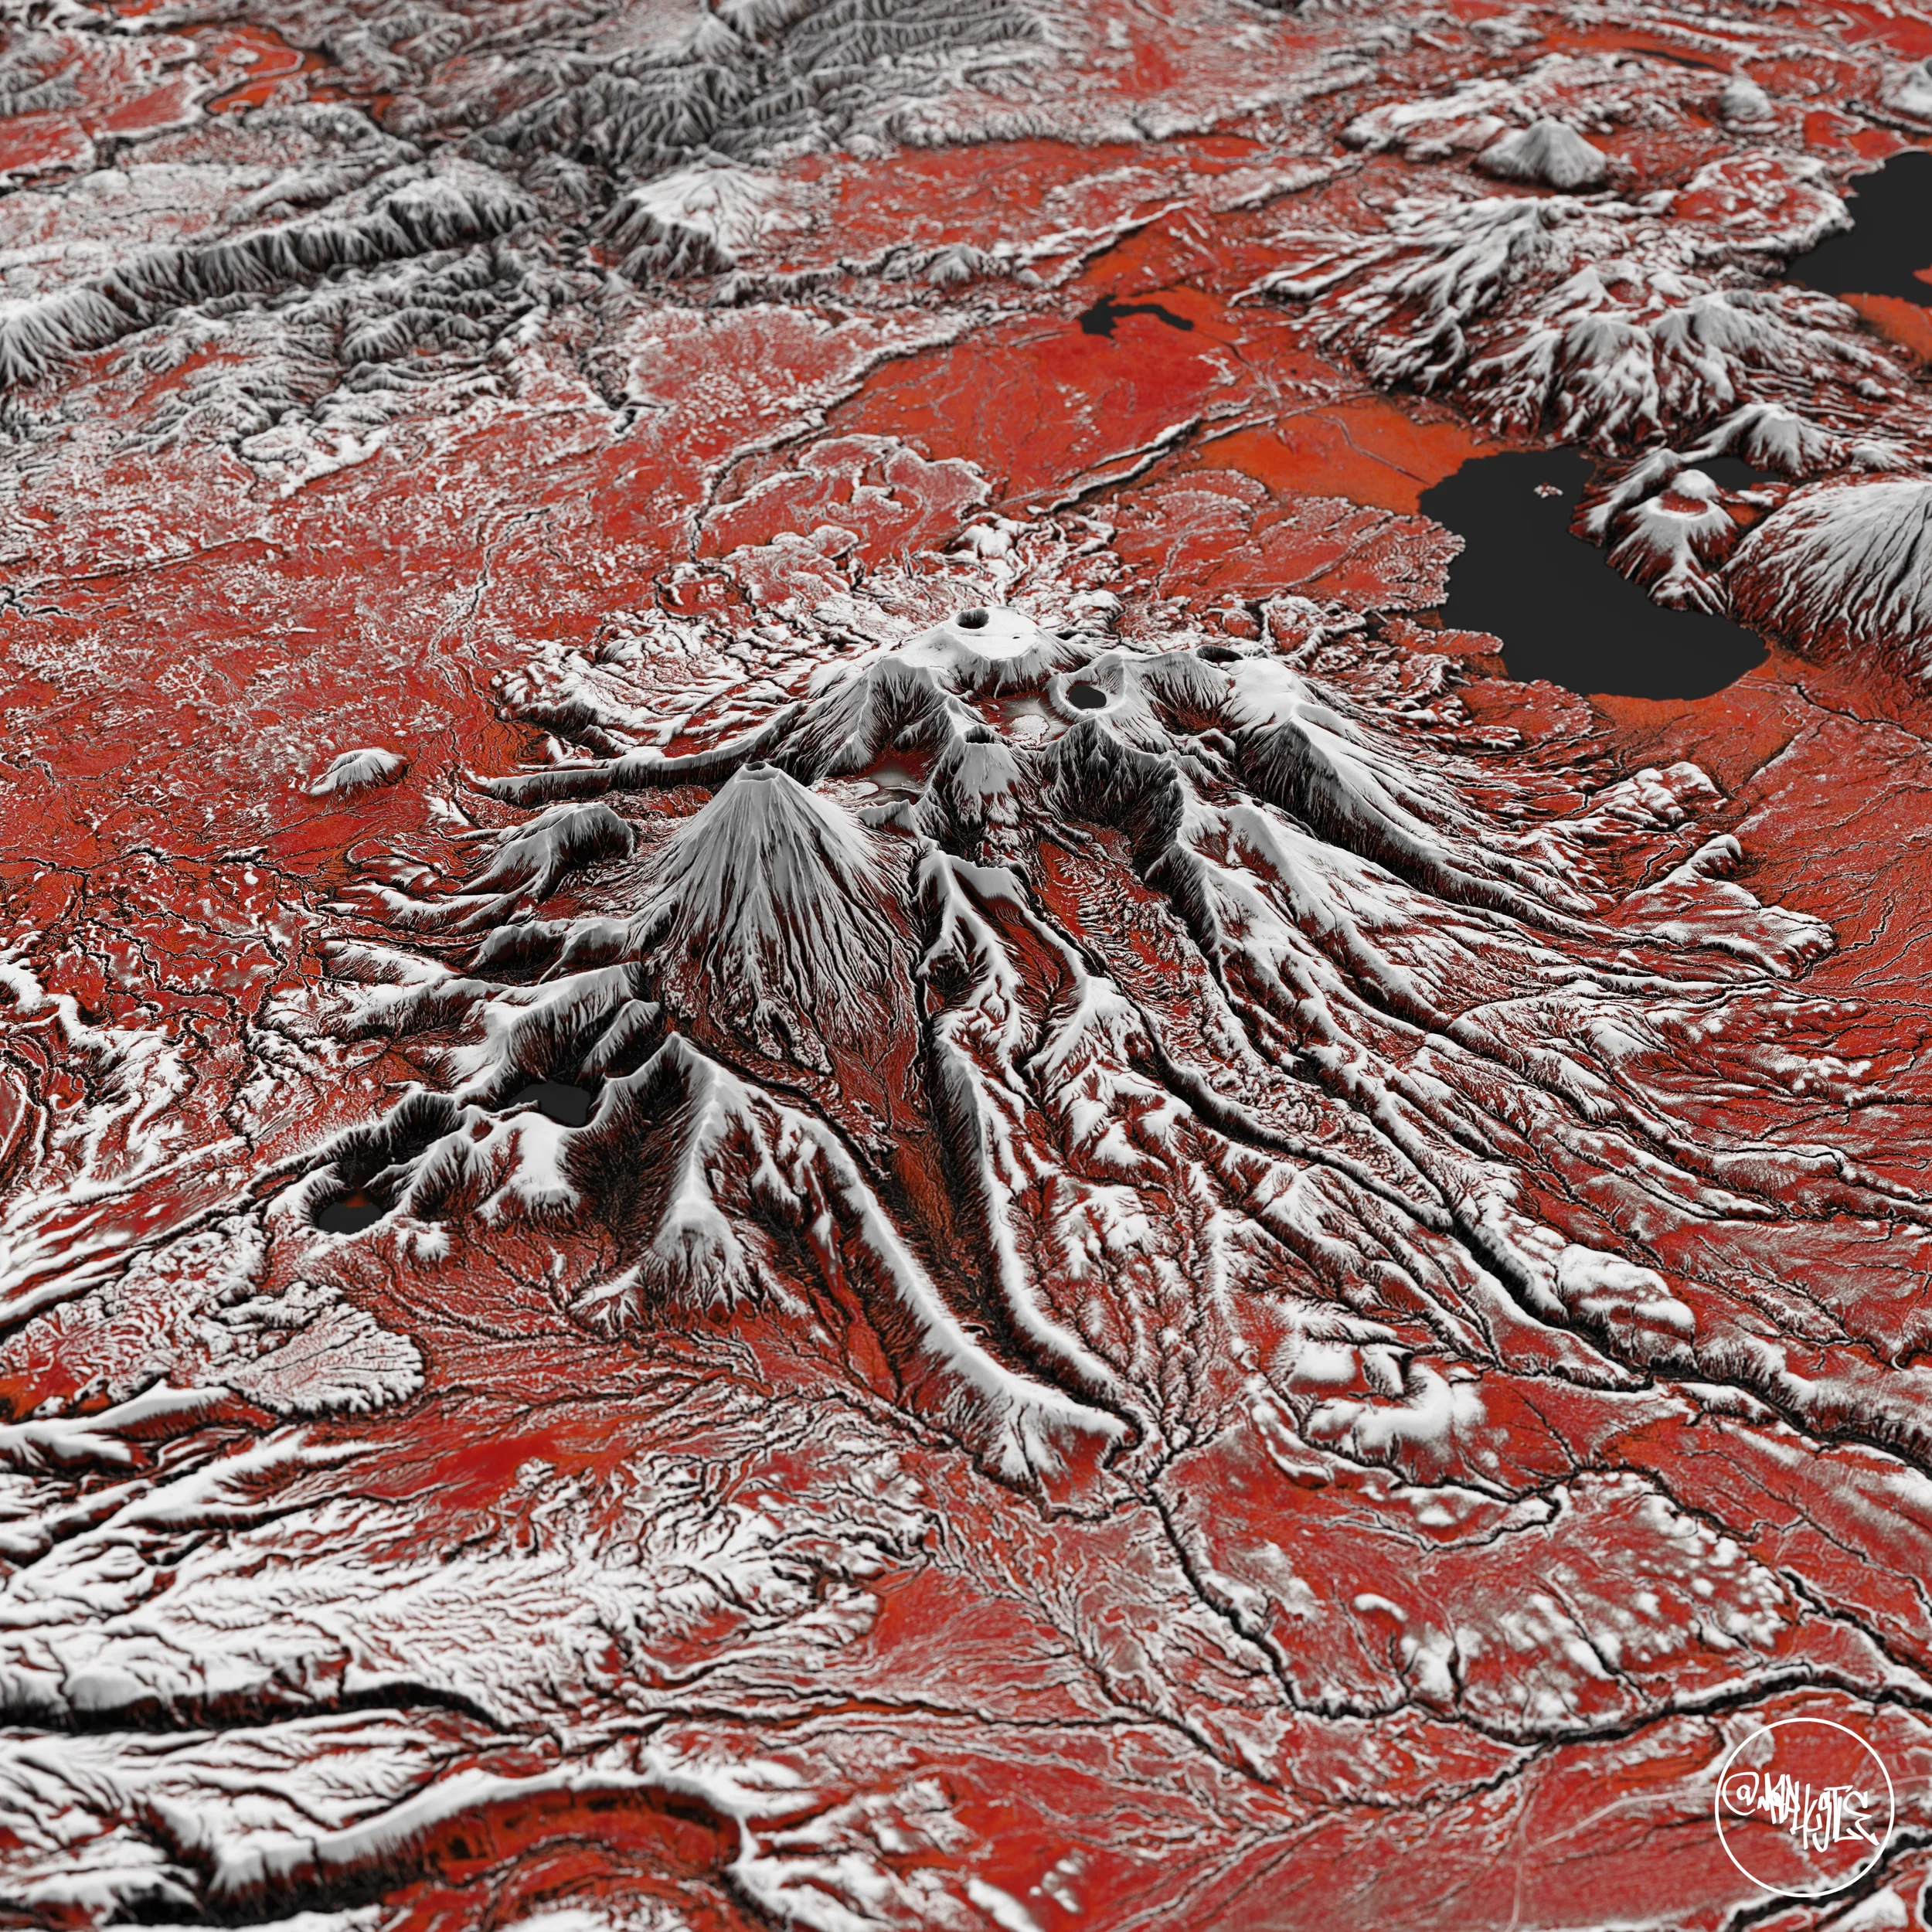
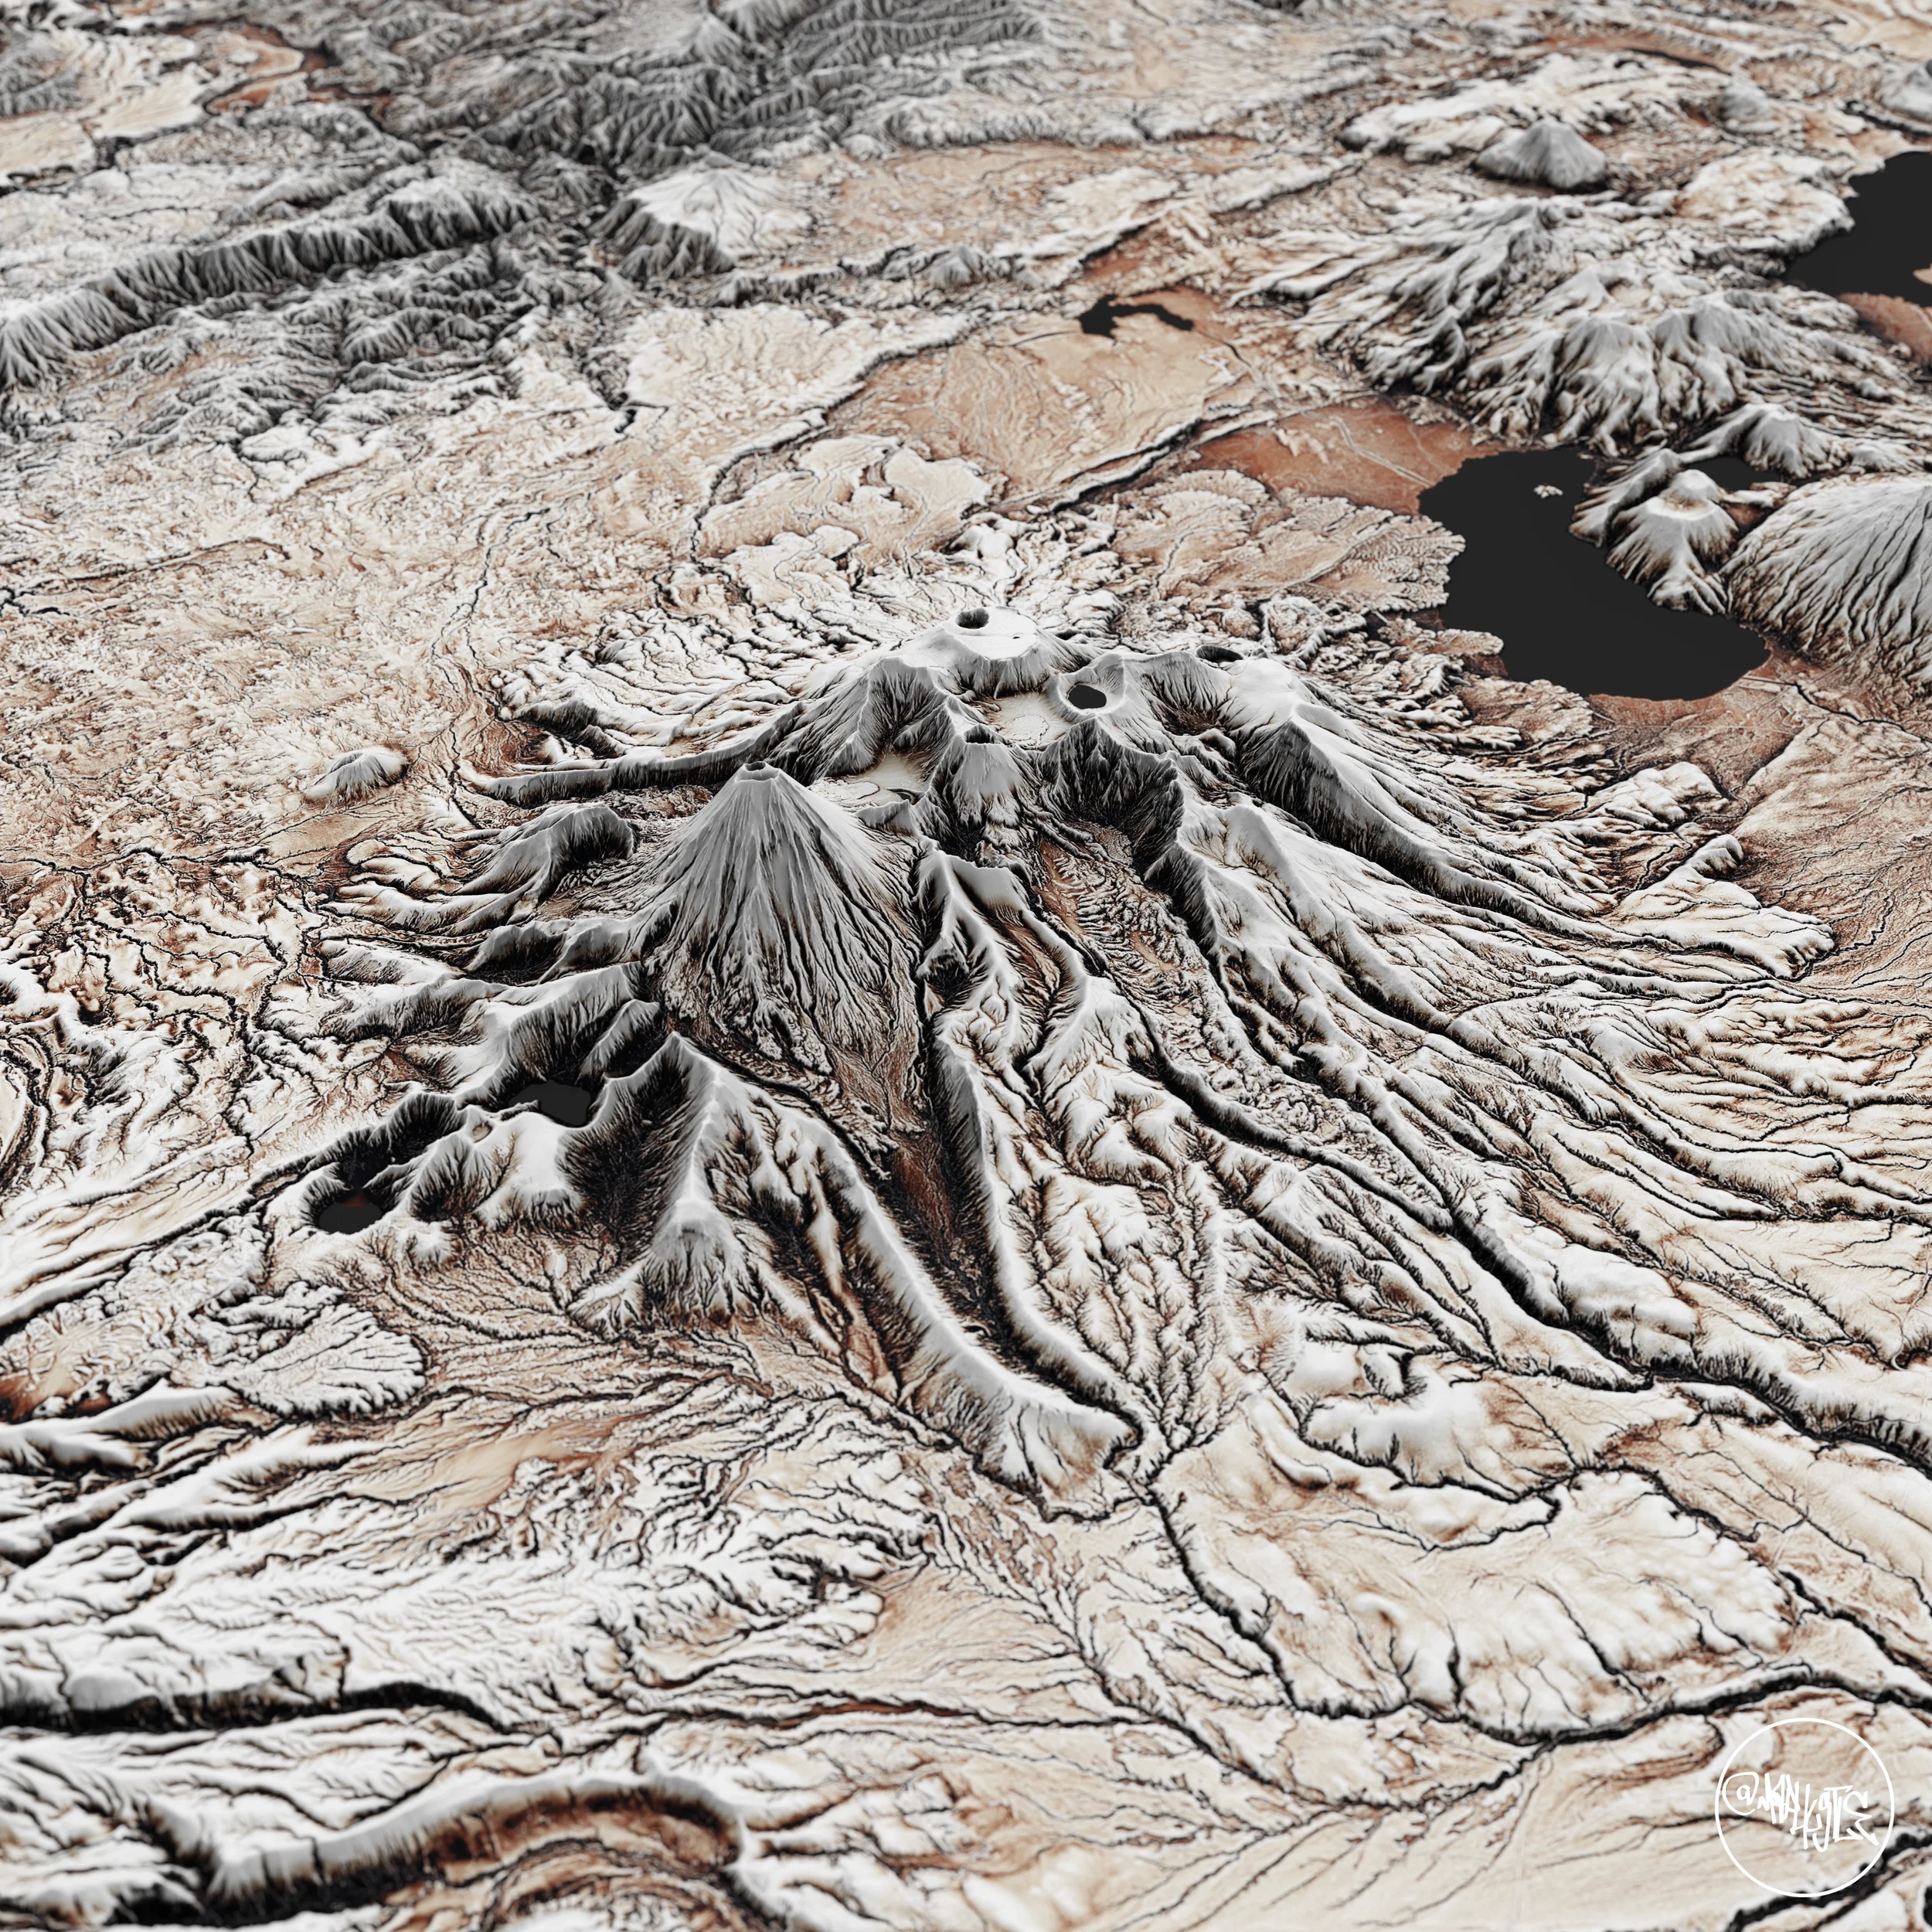
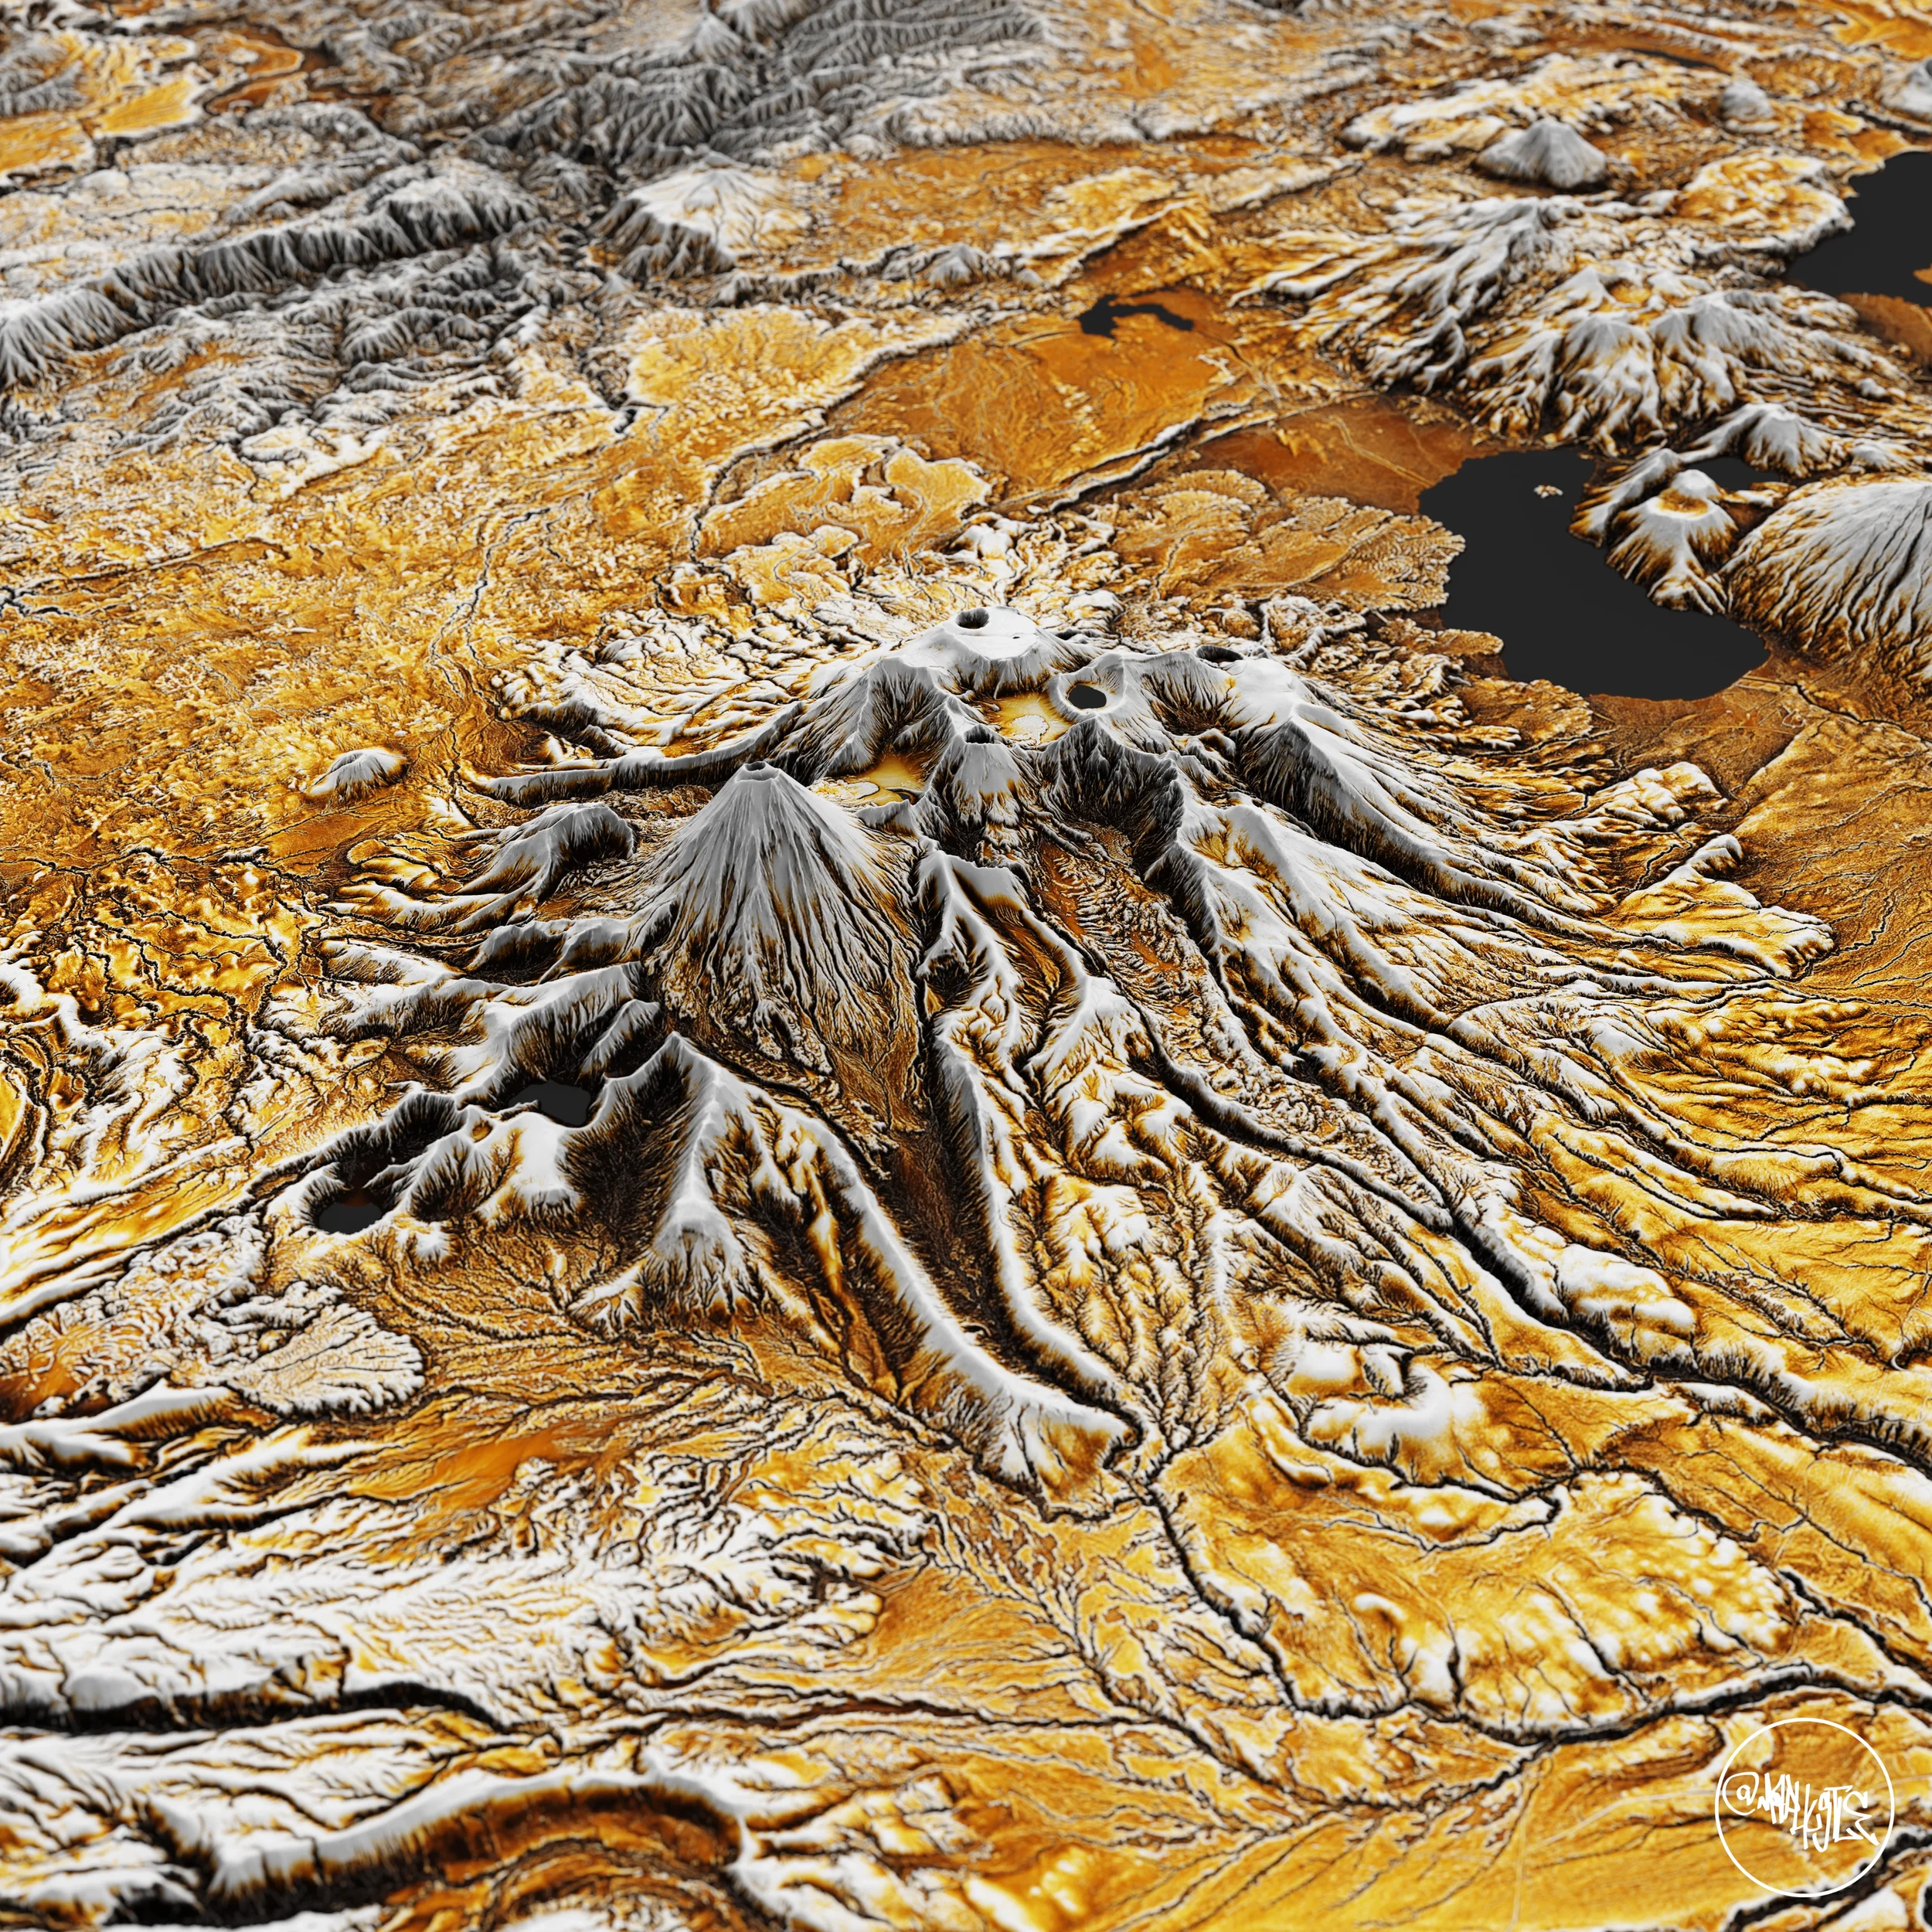
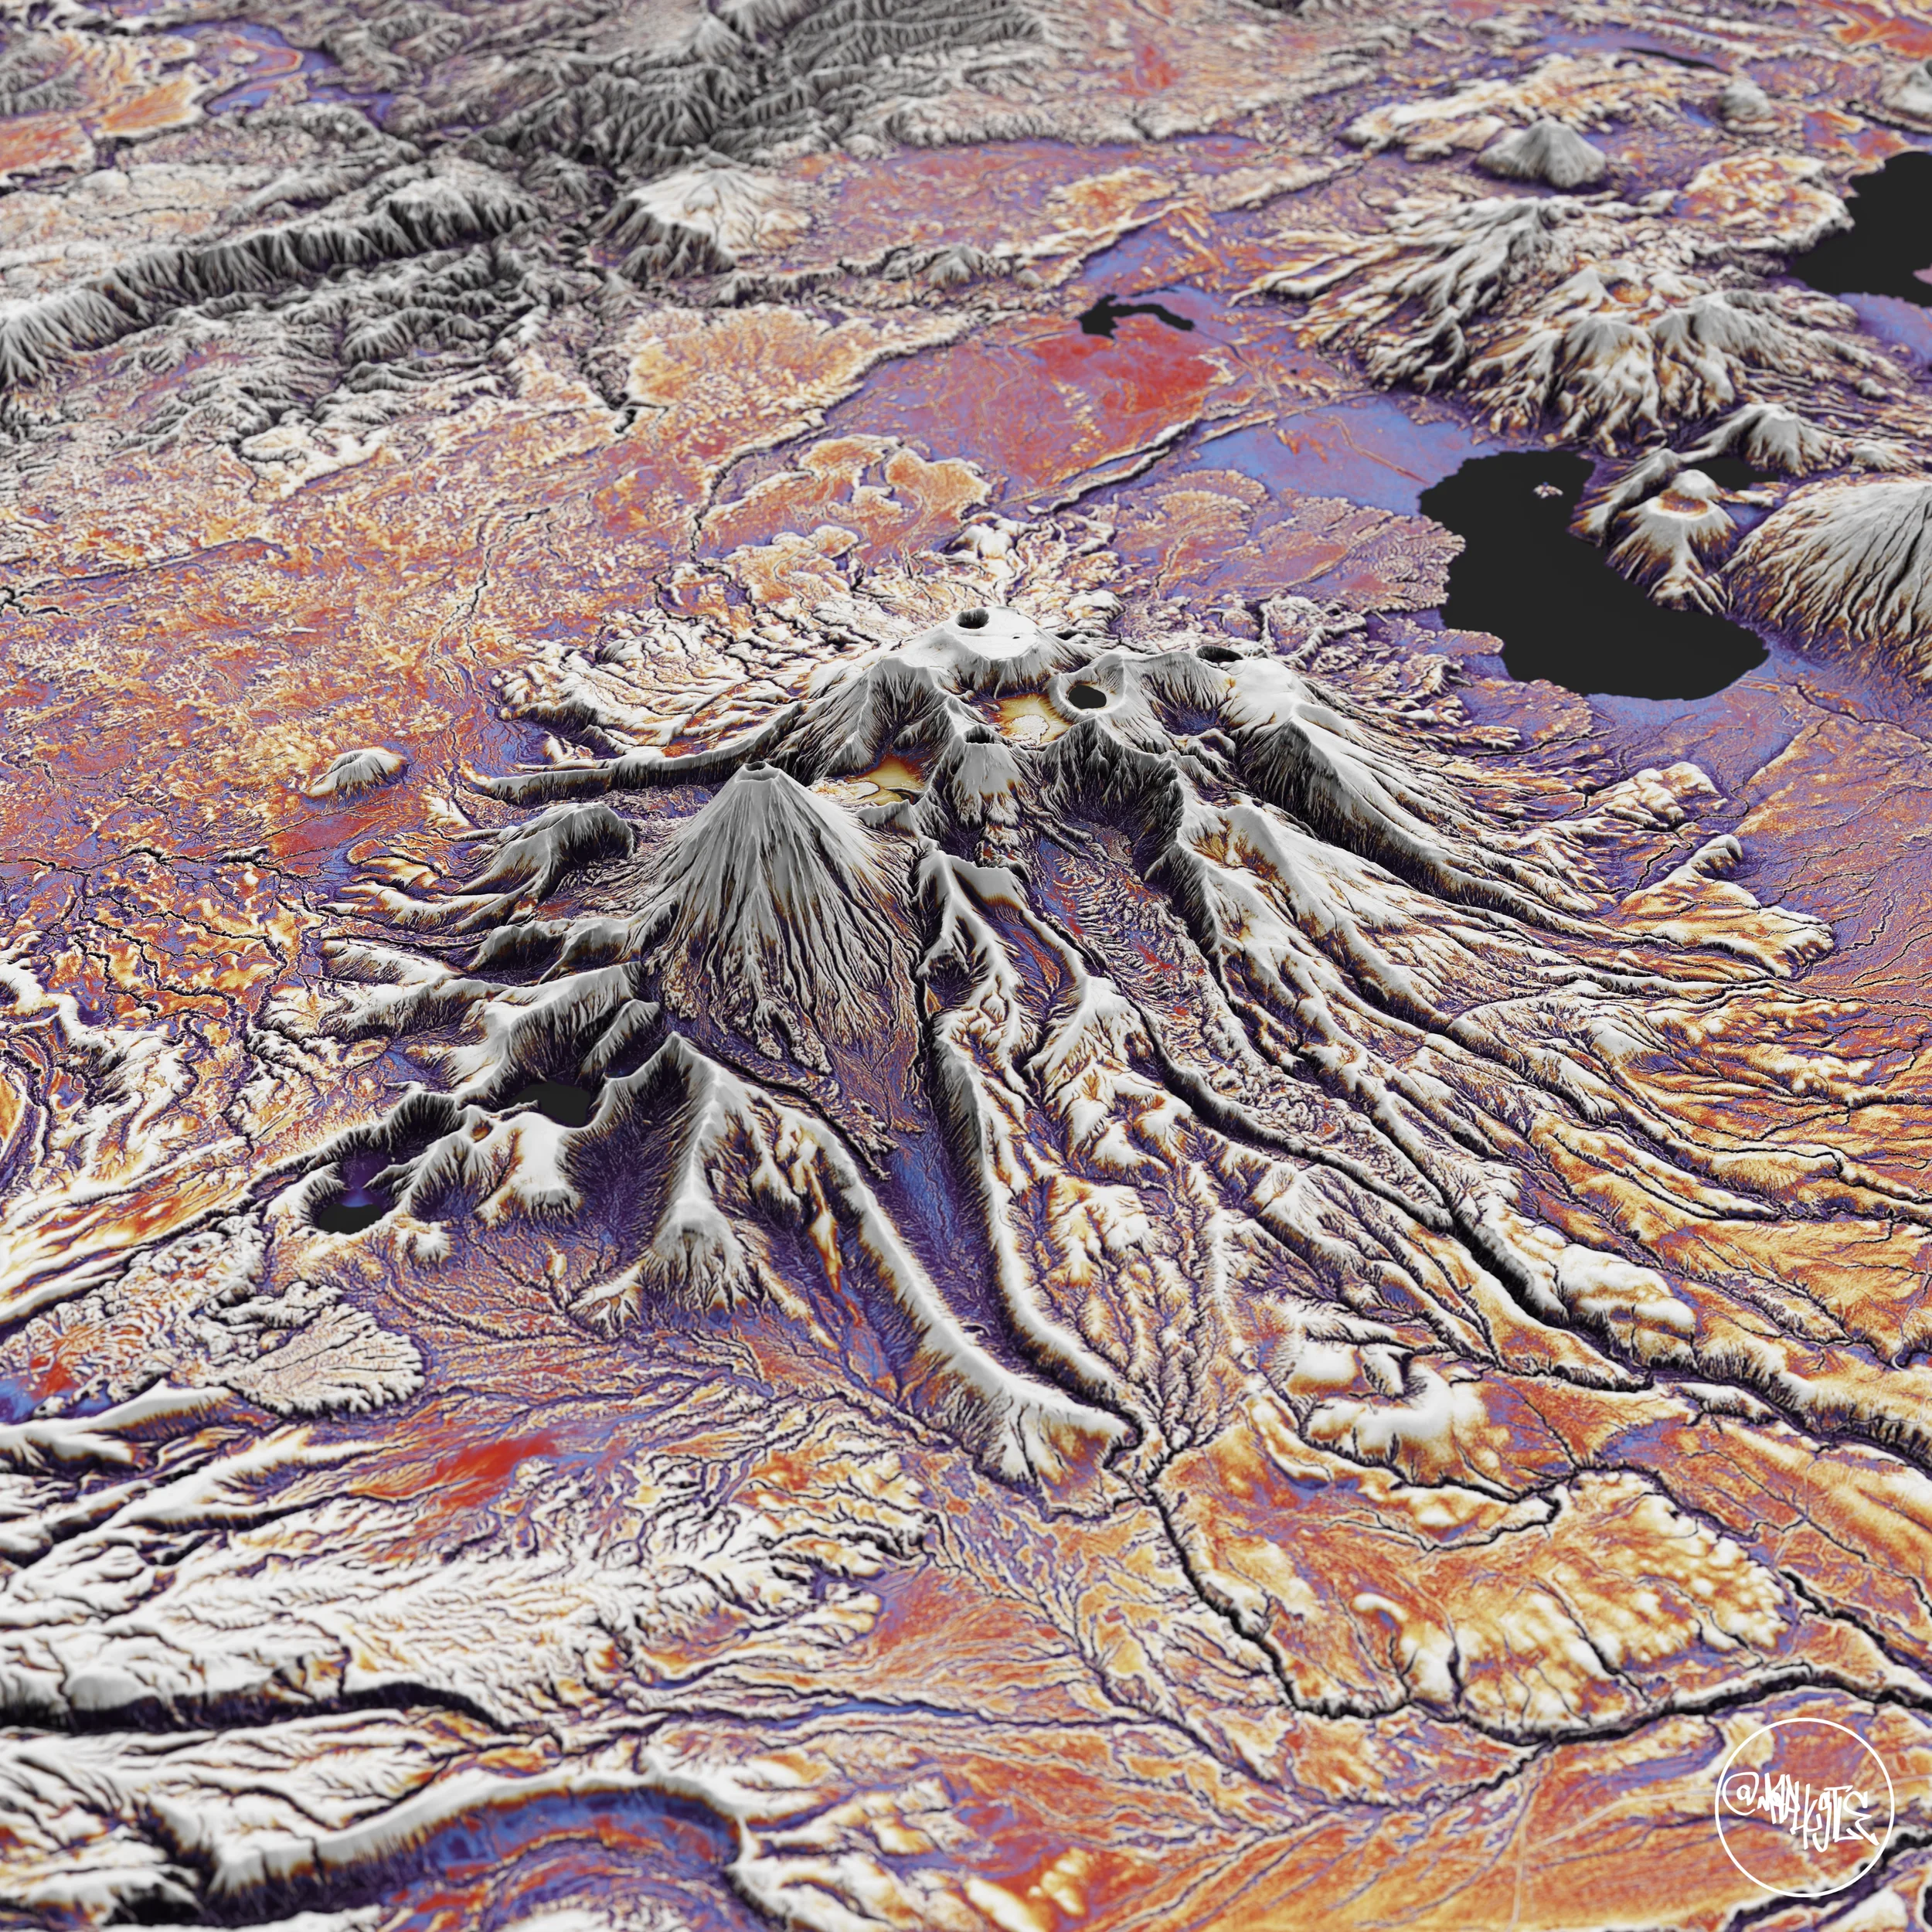
This is an example of a colour palette used, exported from QGIS.
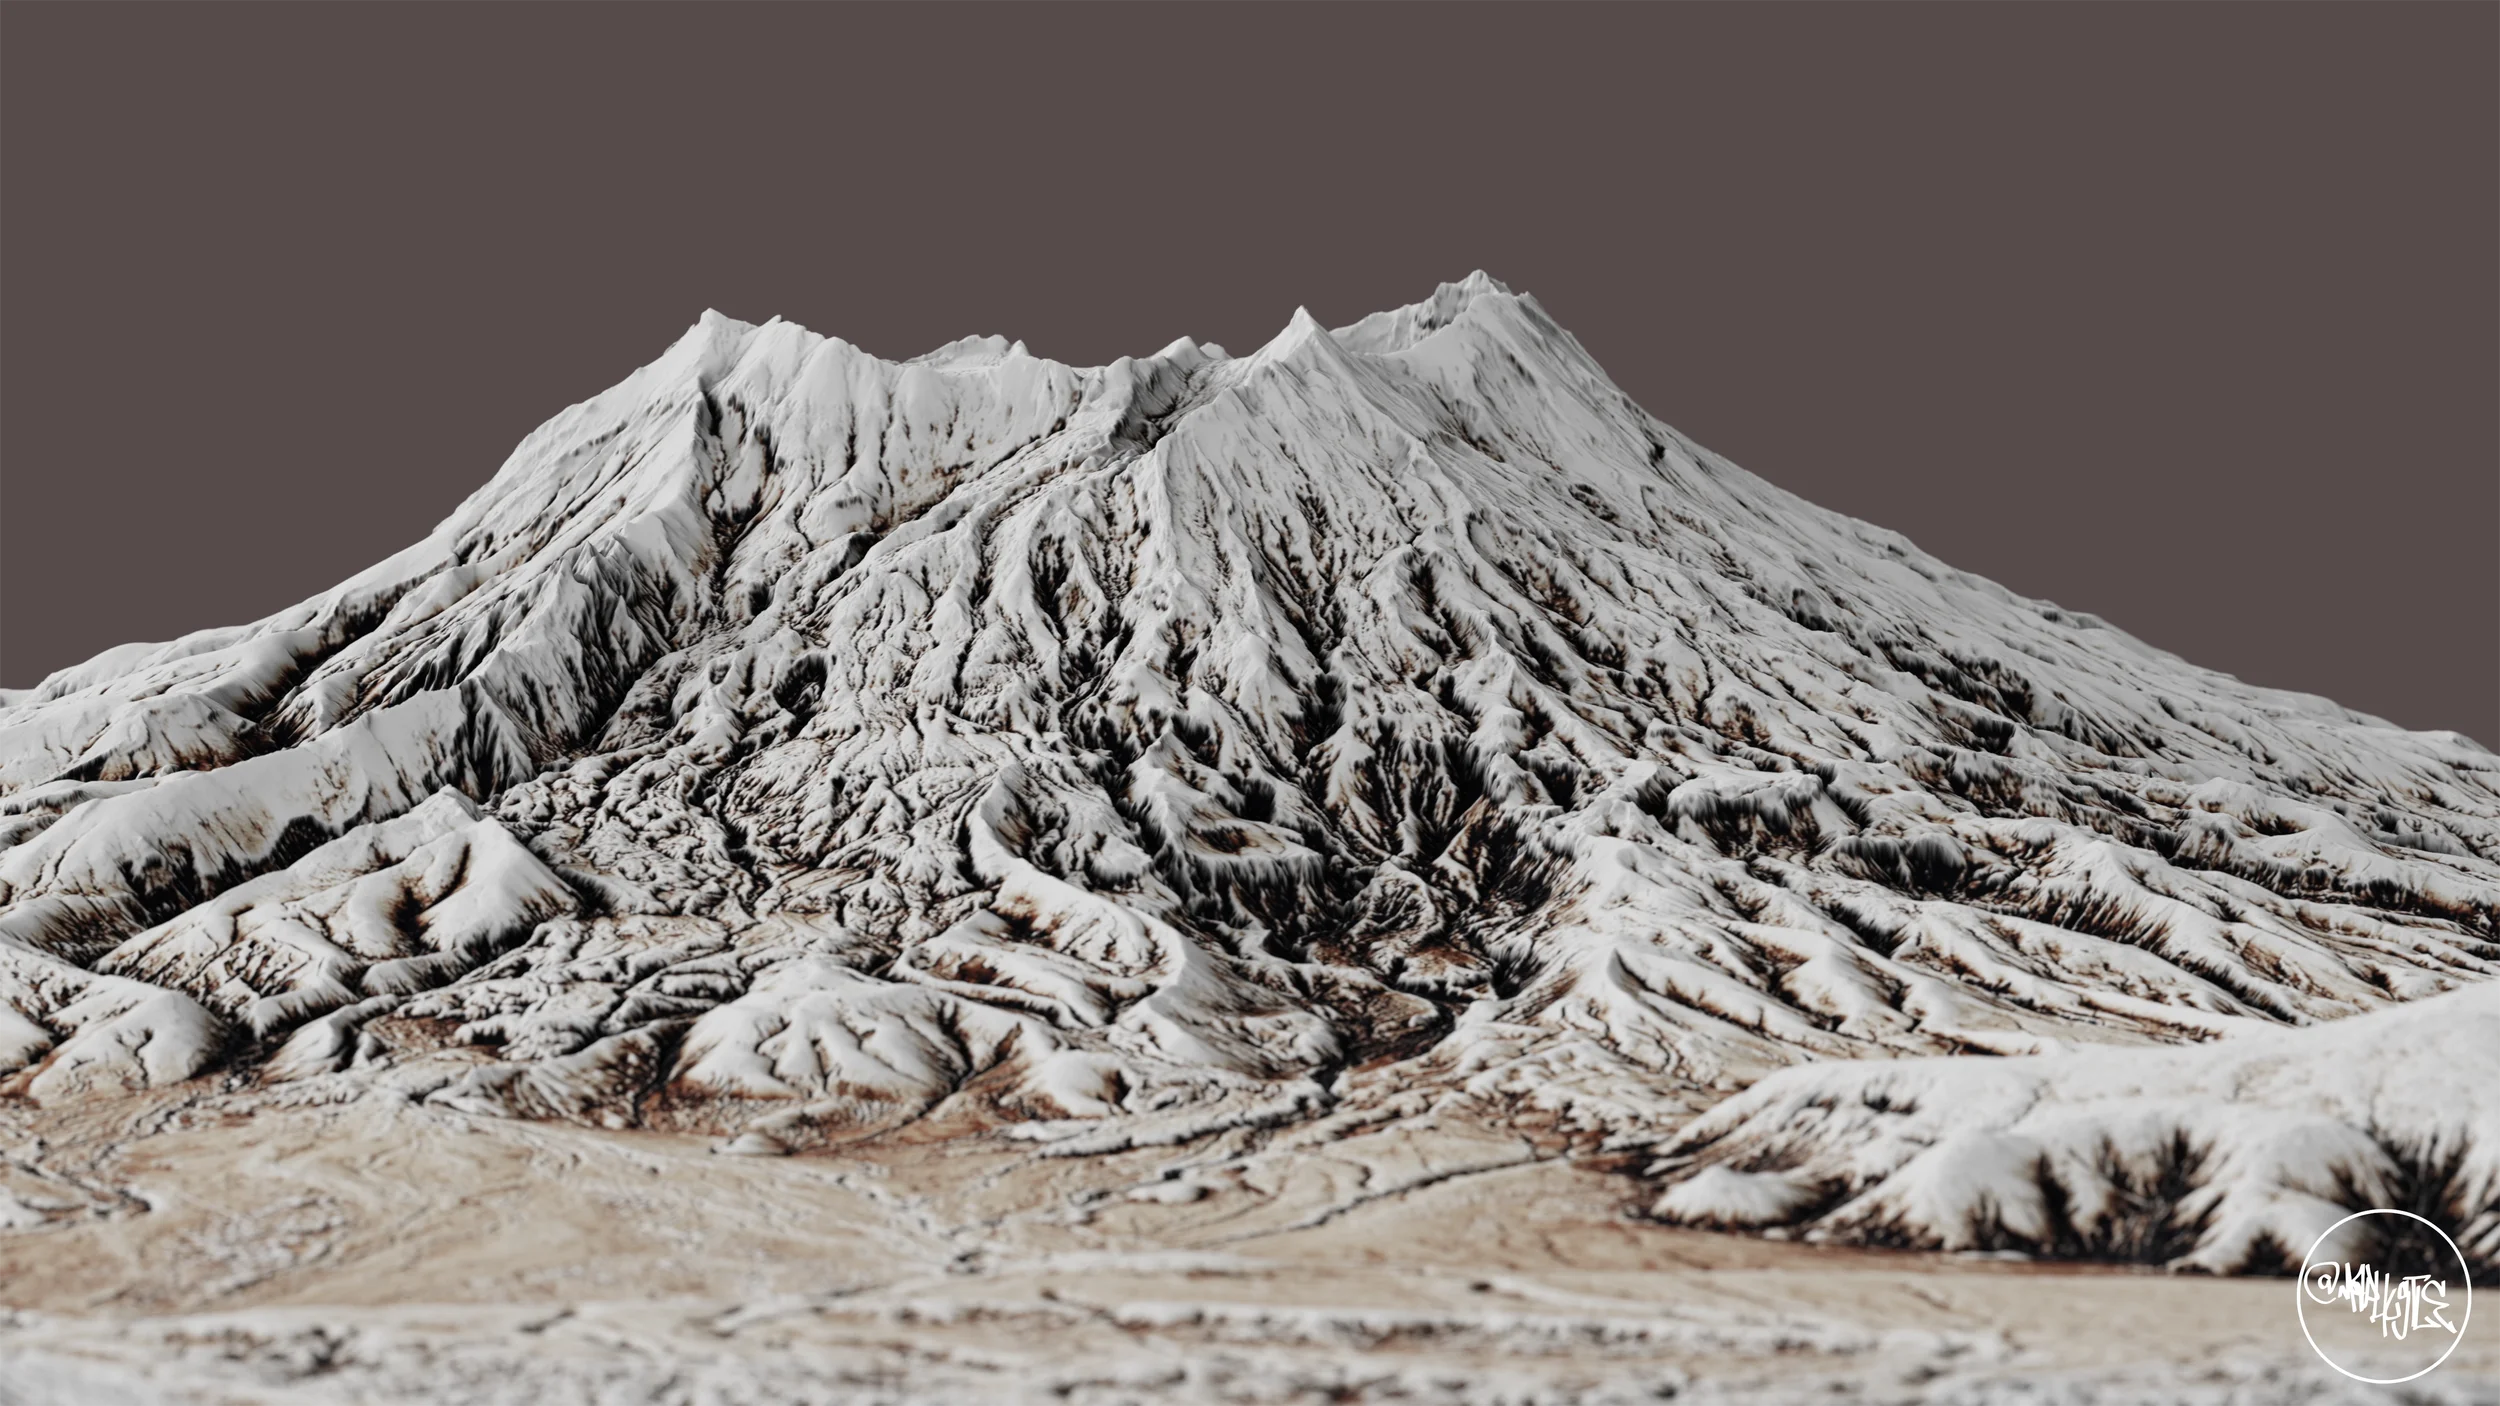
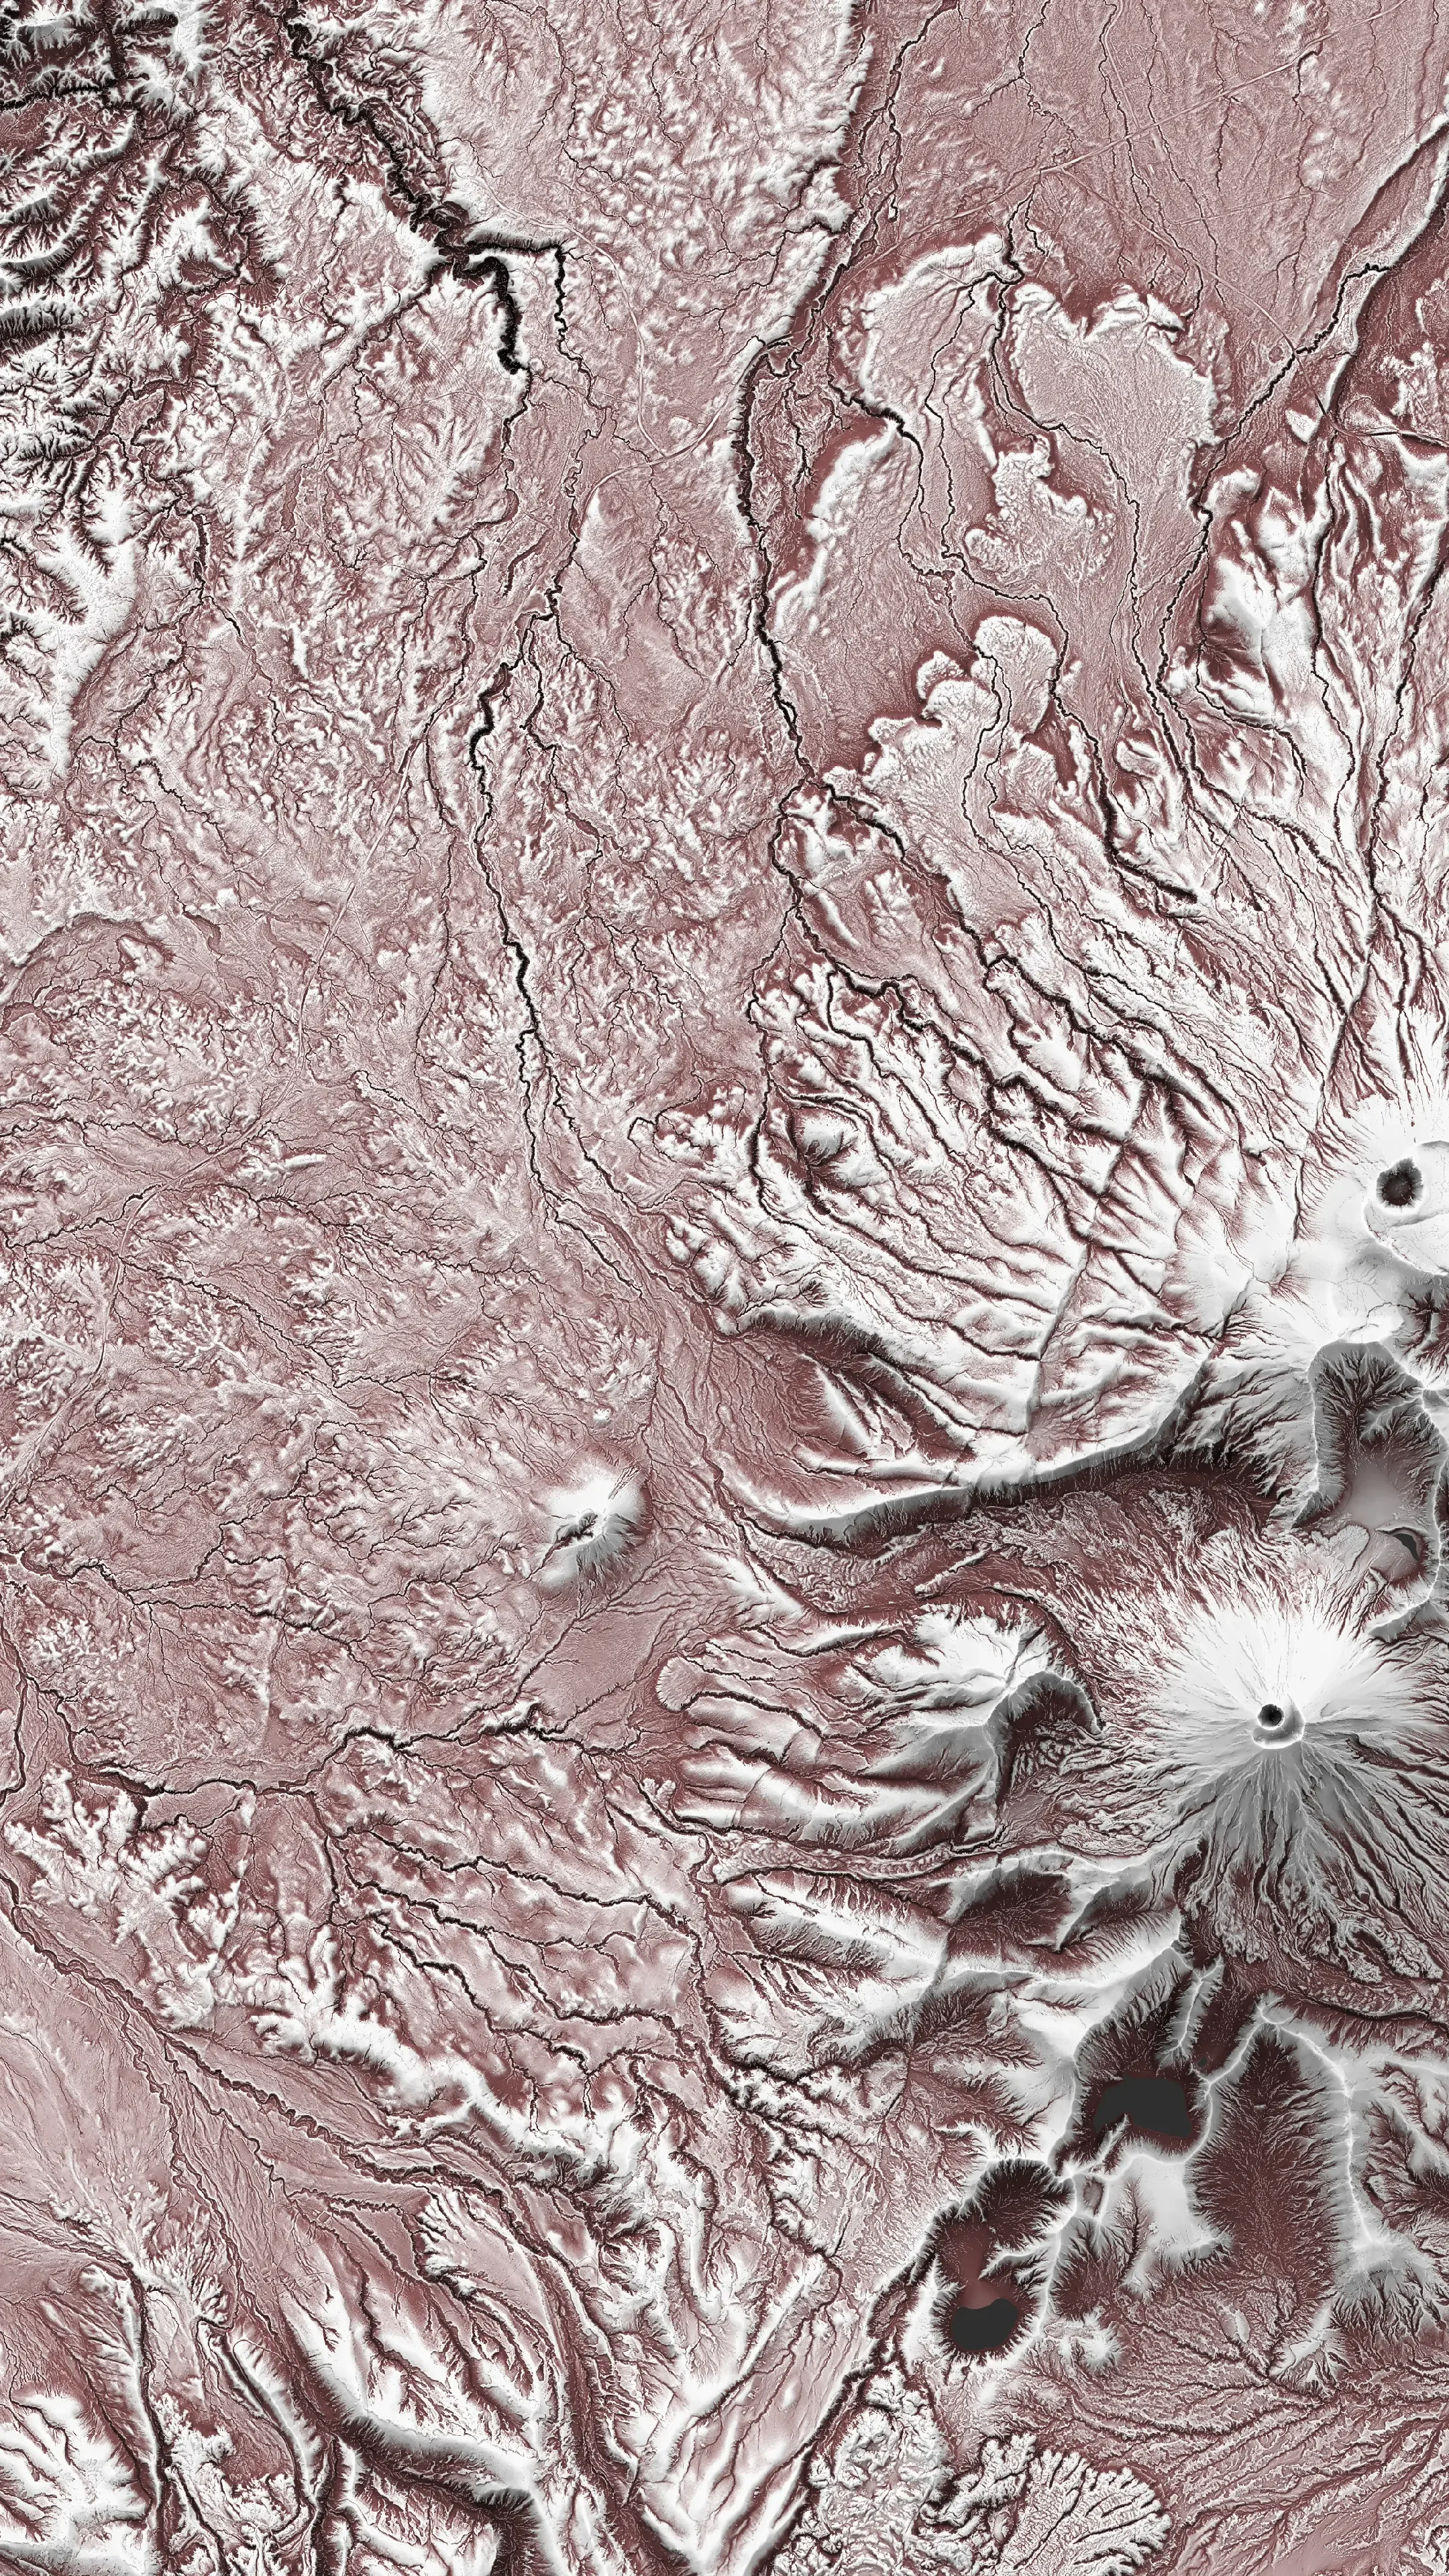
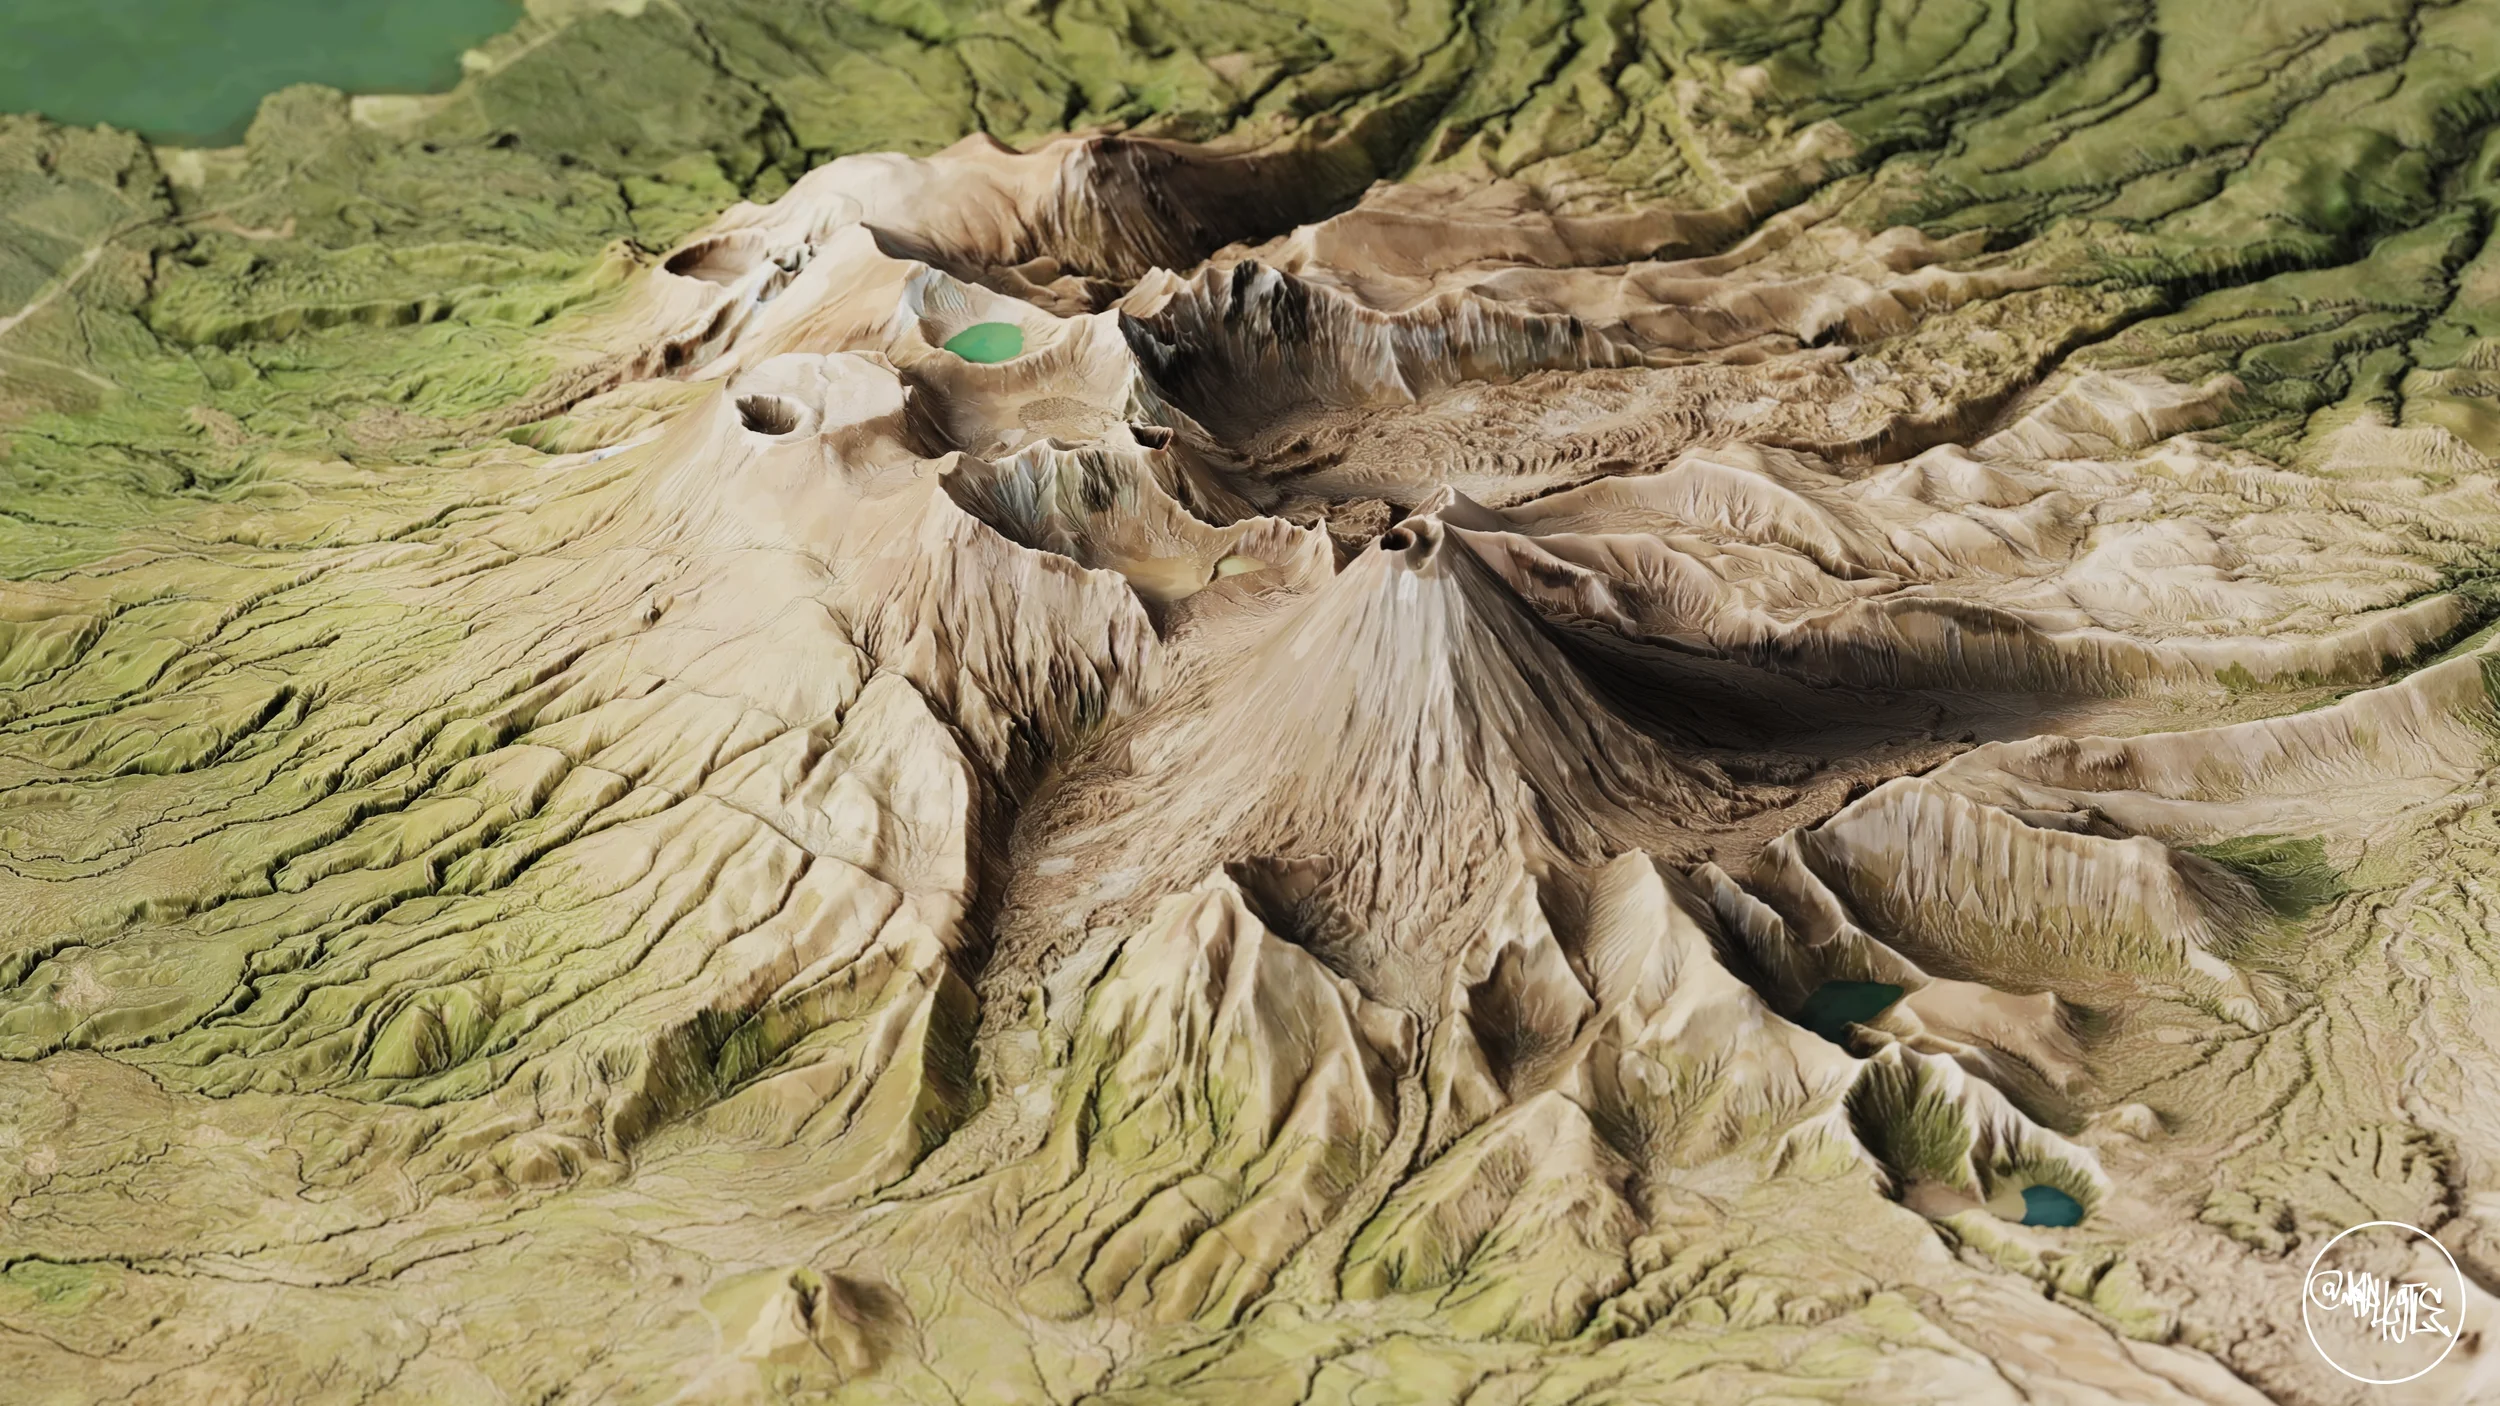
Mt Ruapehu
Due to data availability constraints, I can only show the west facing side at fairly restricted angles.
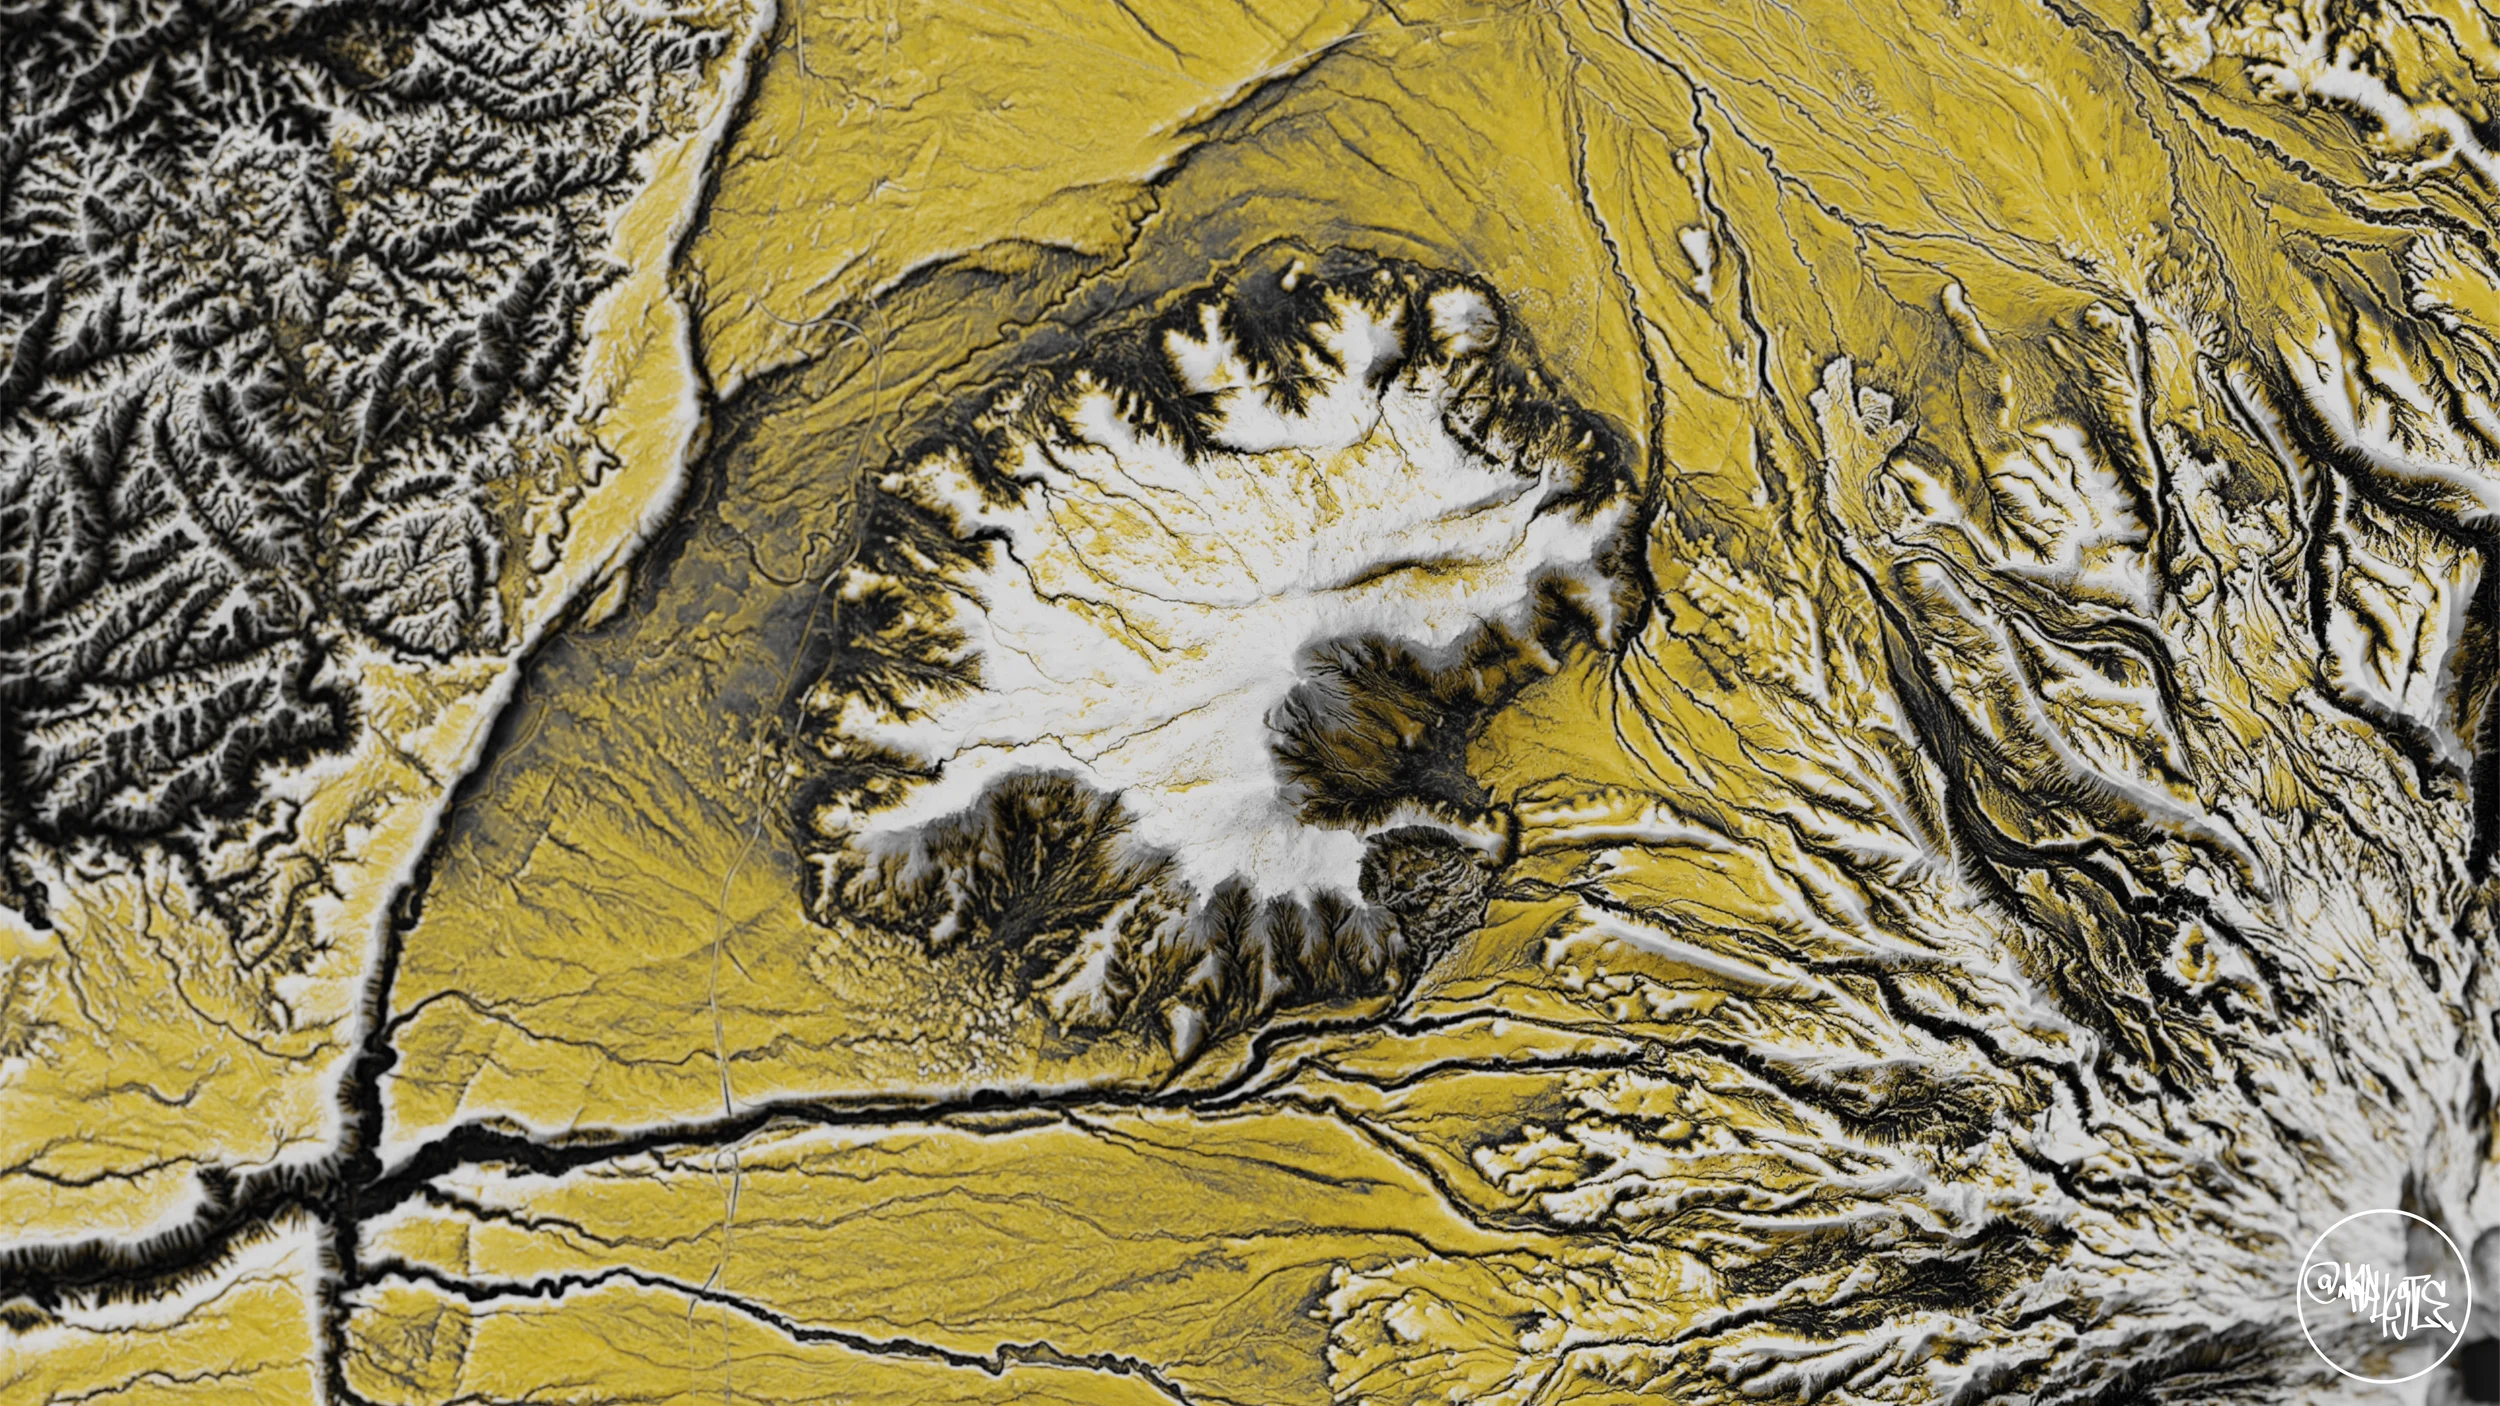
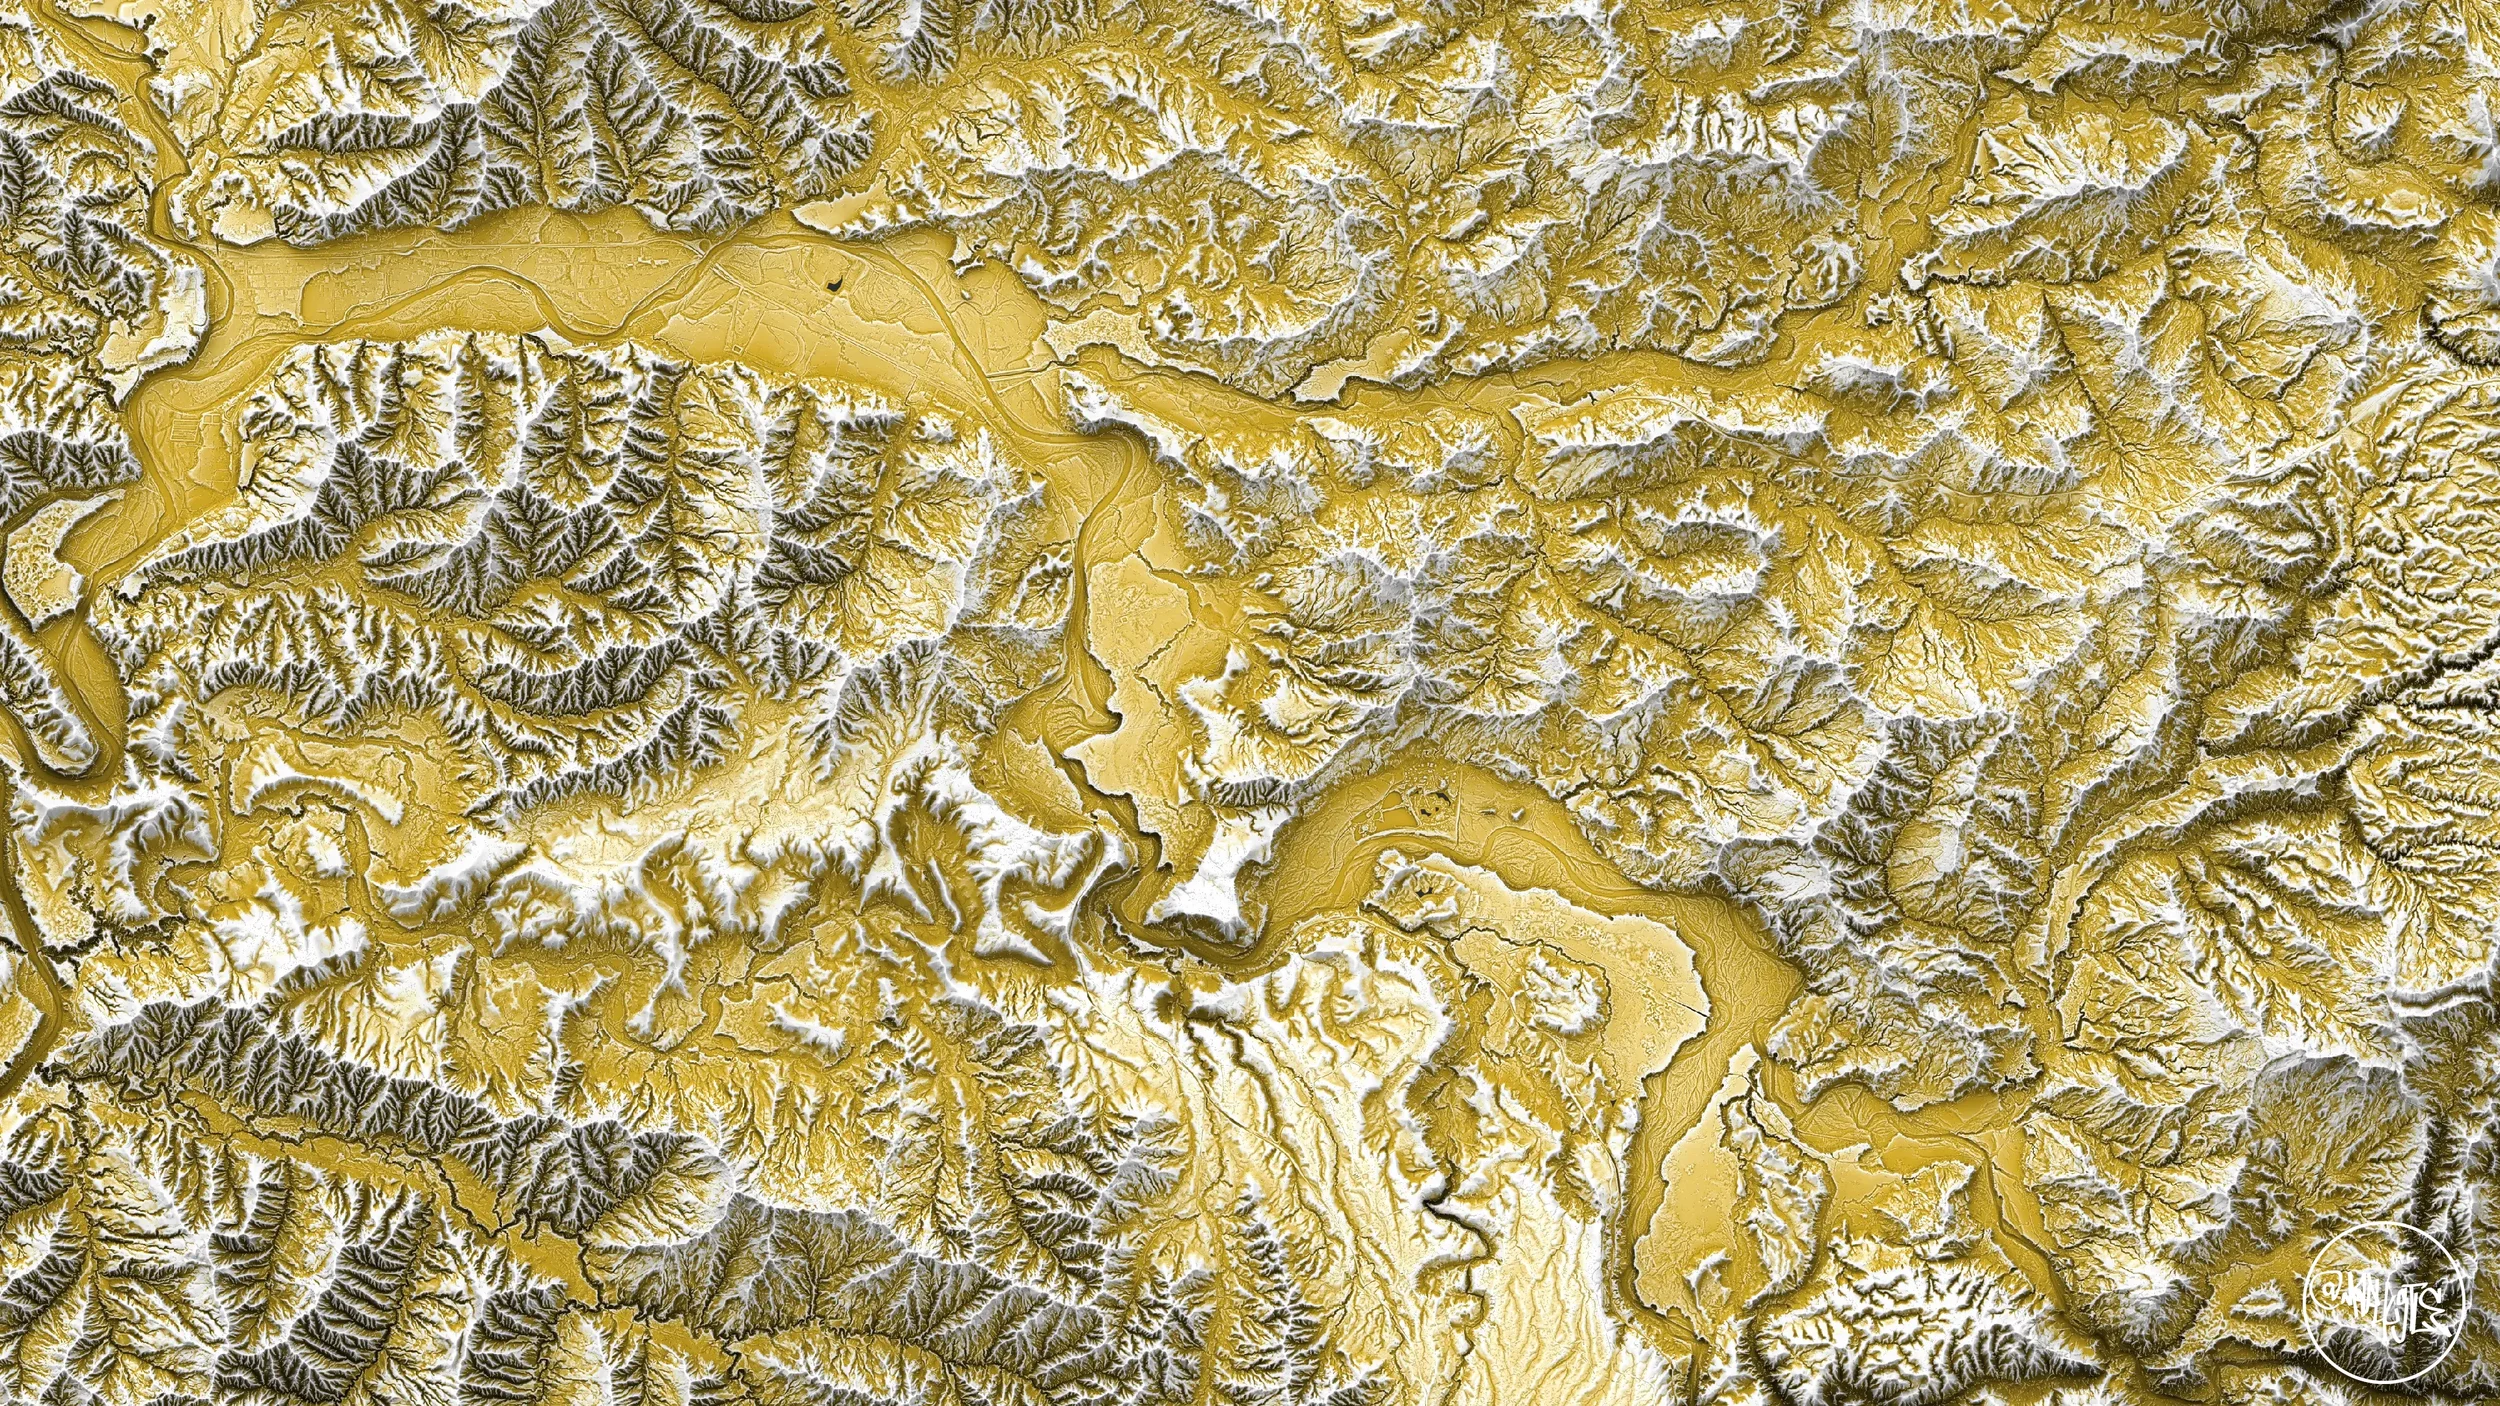
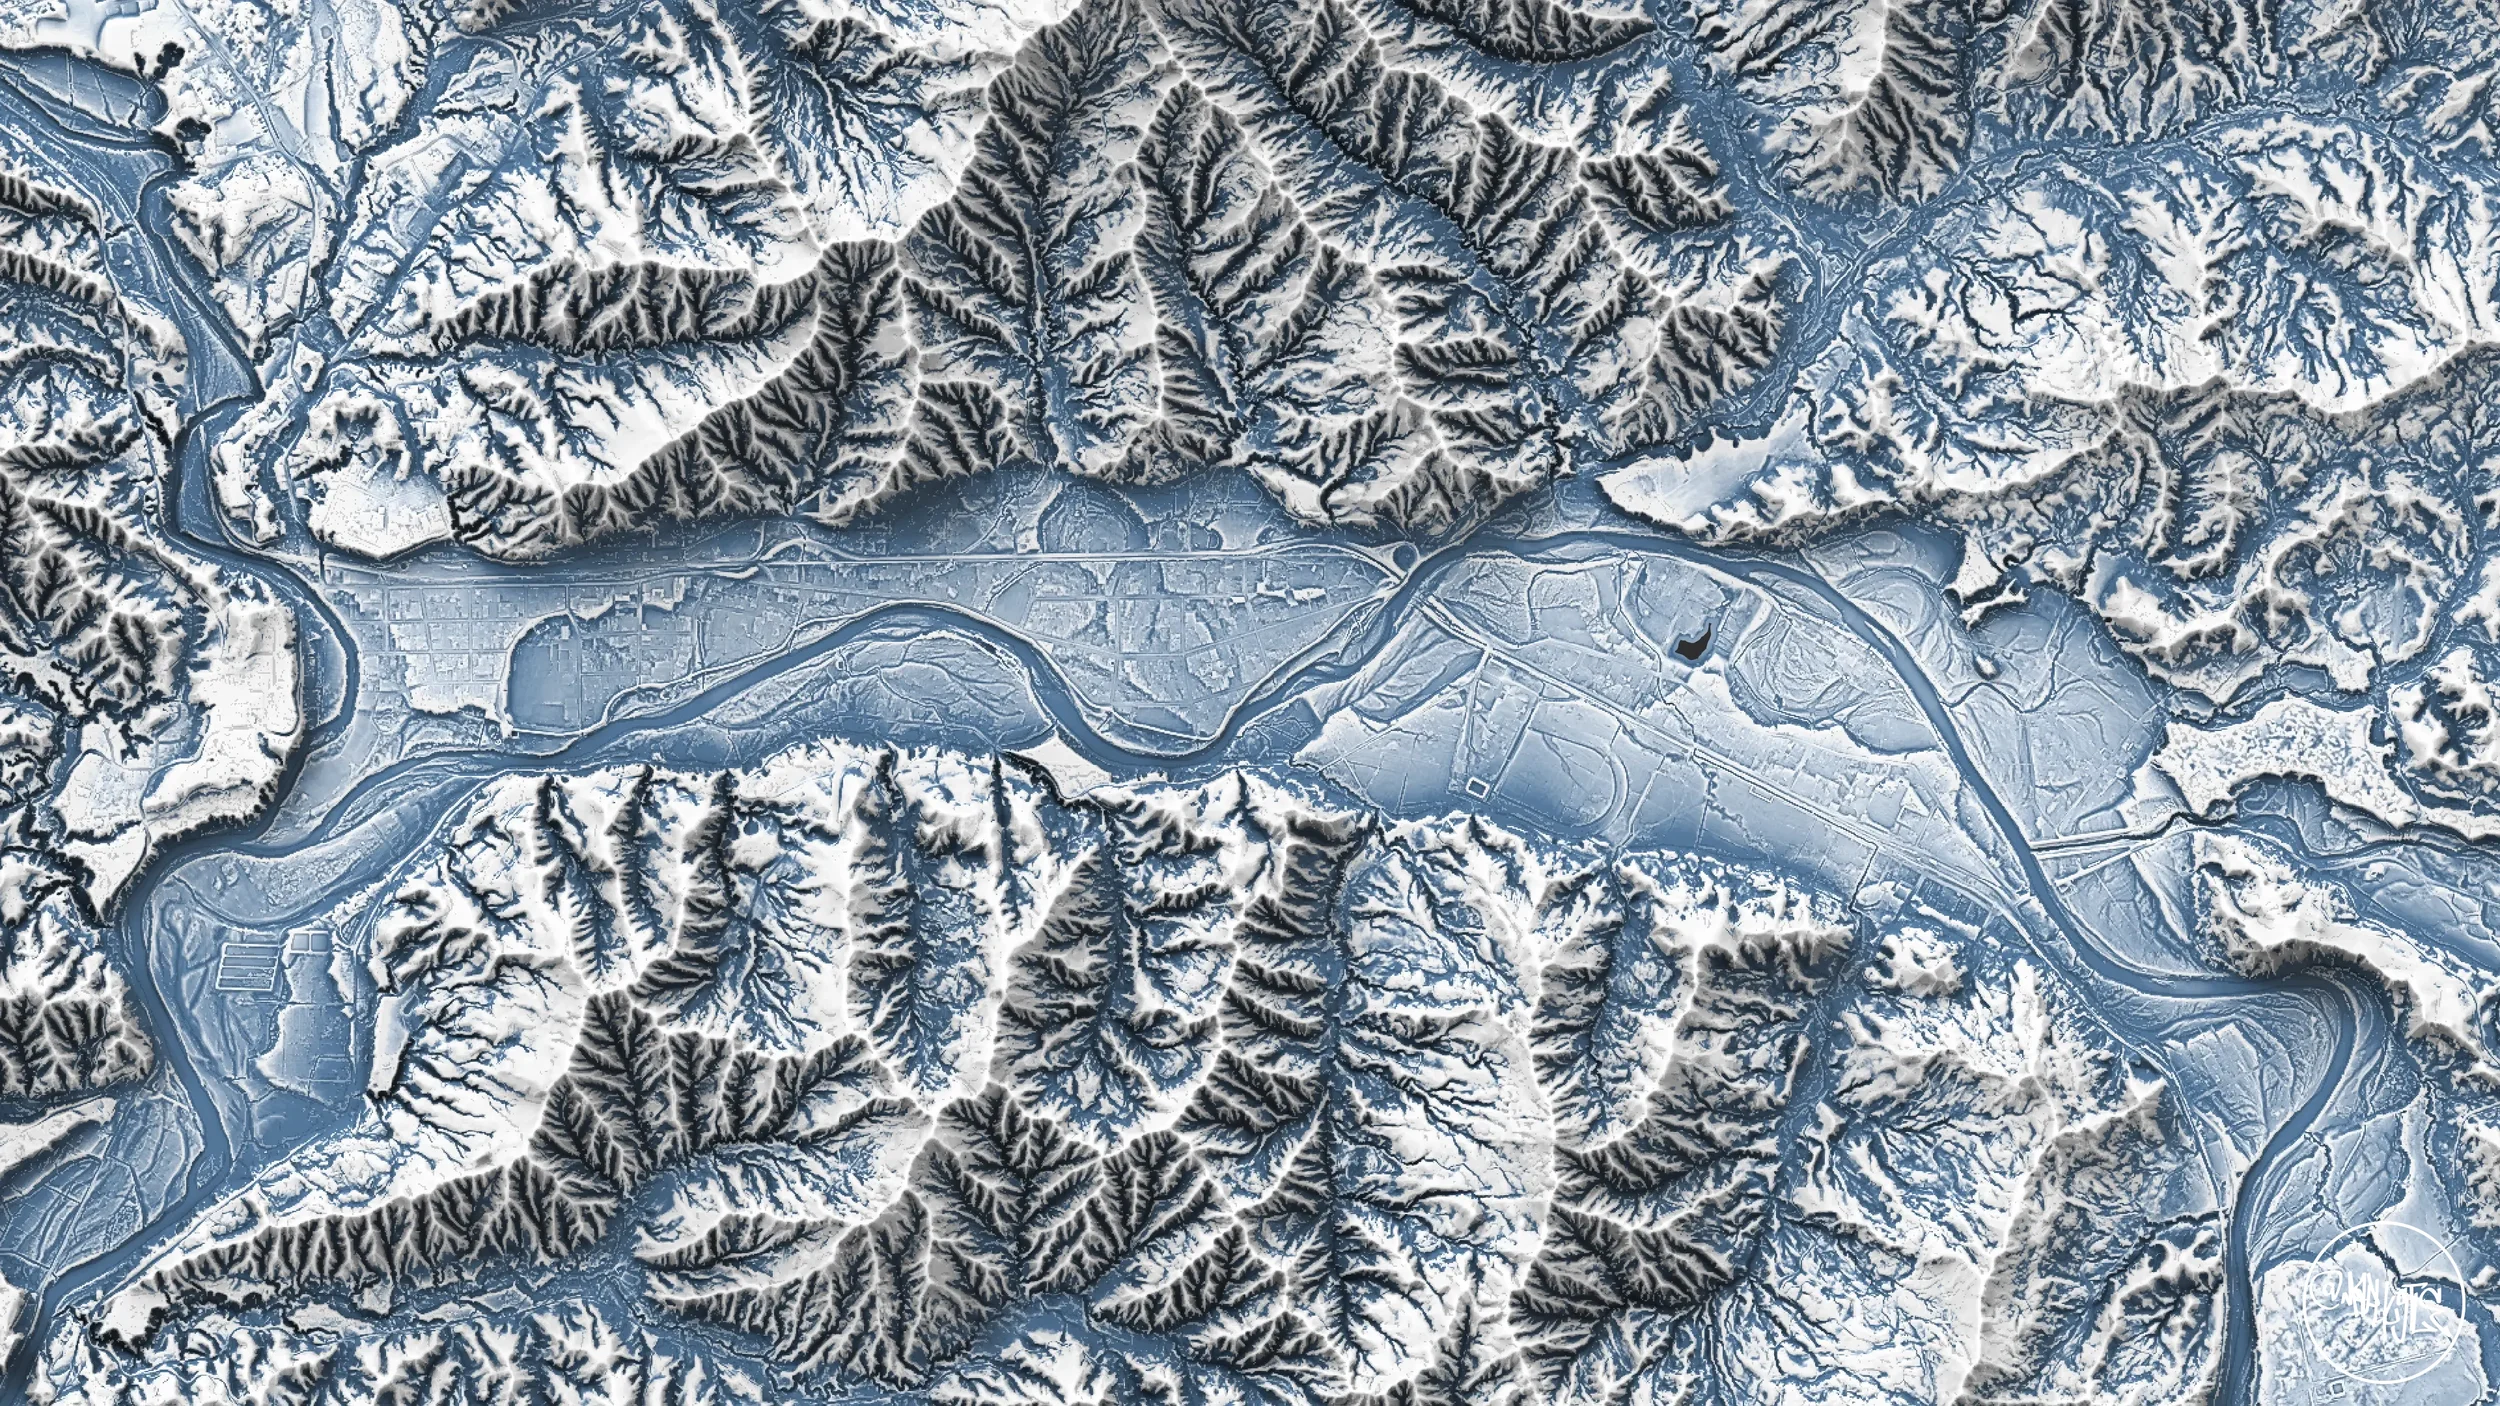
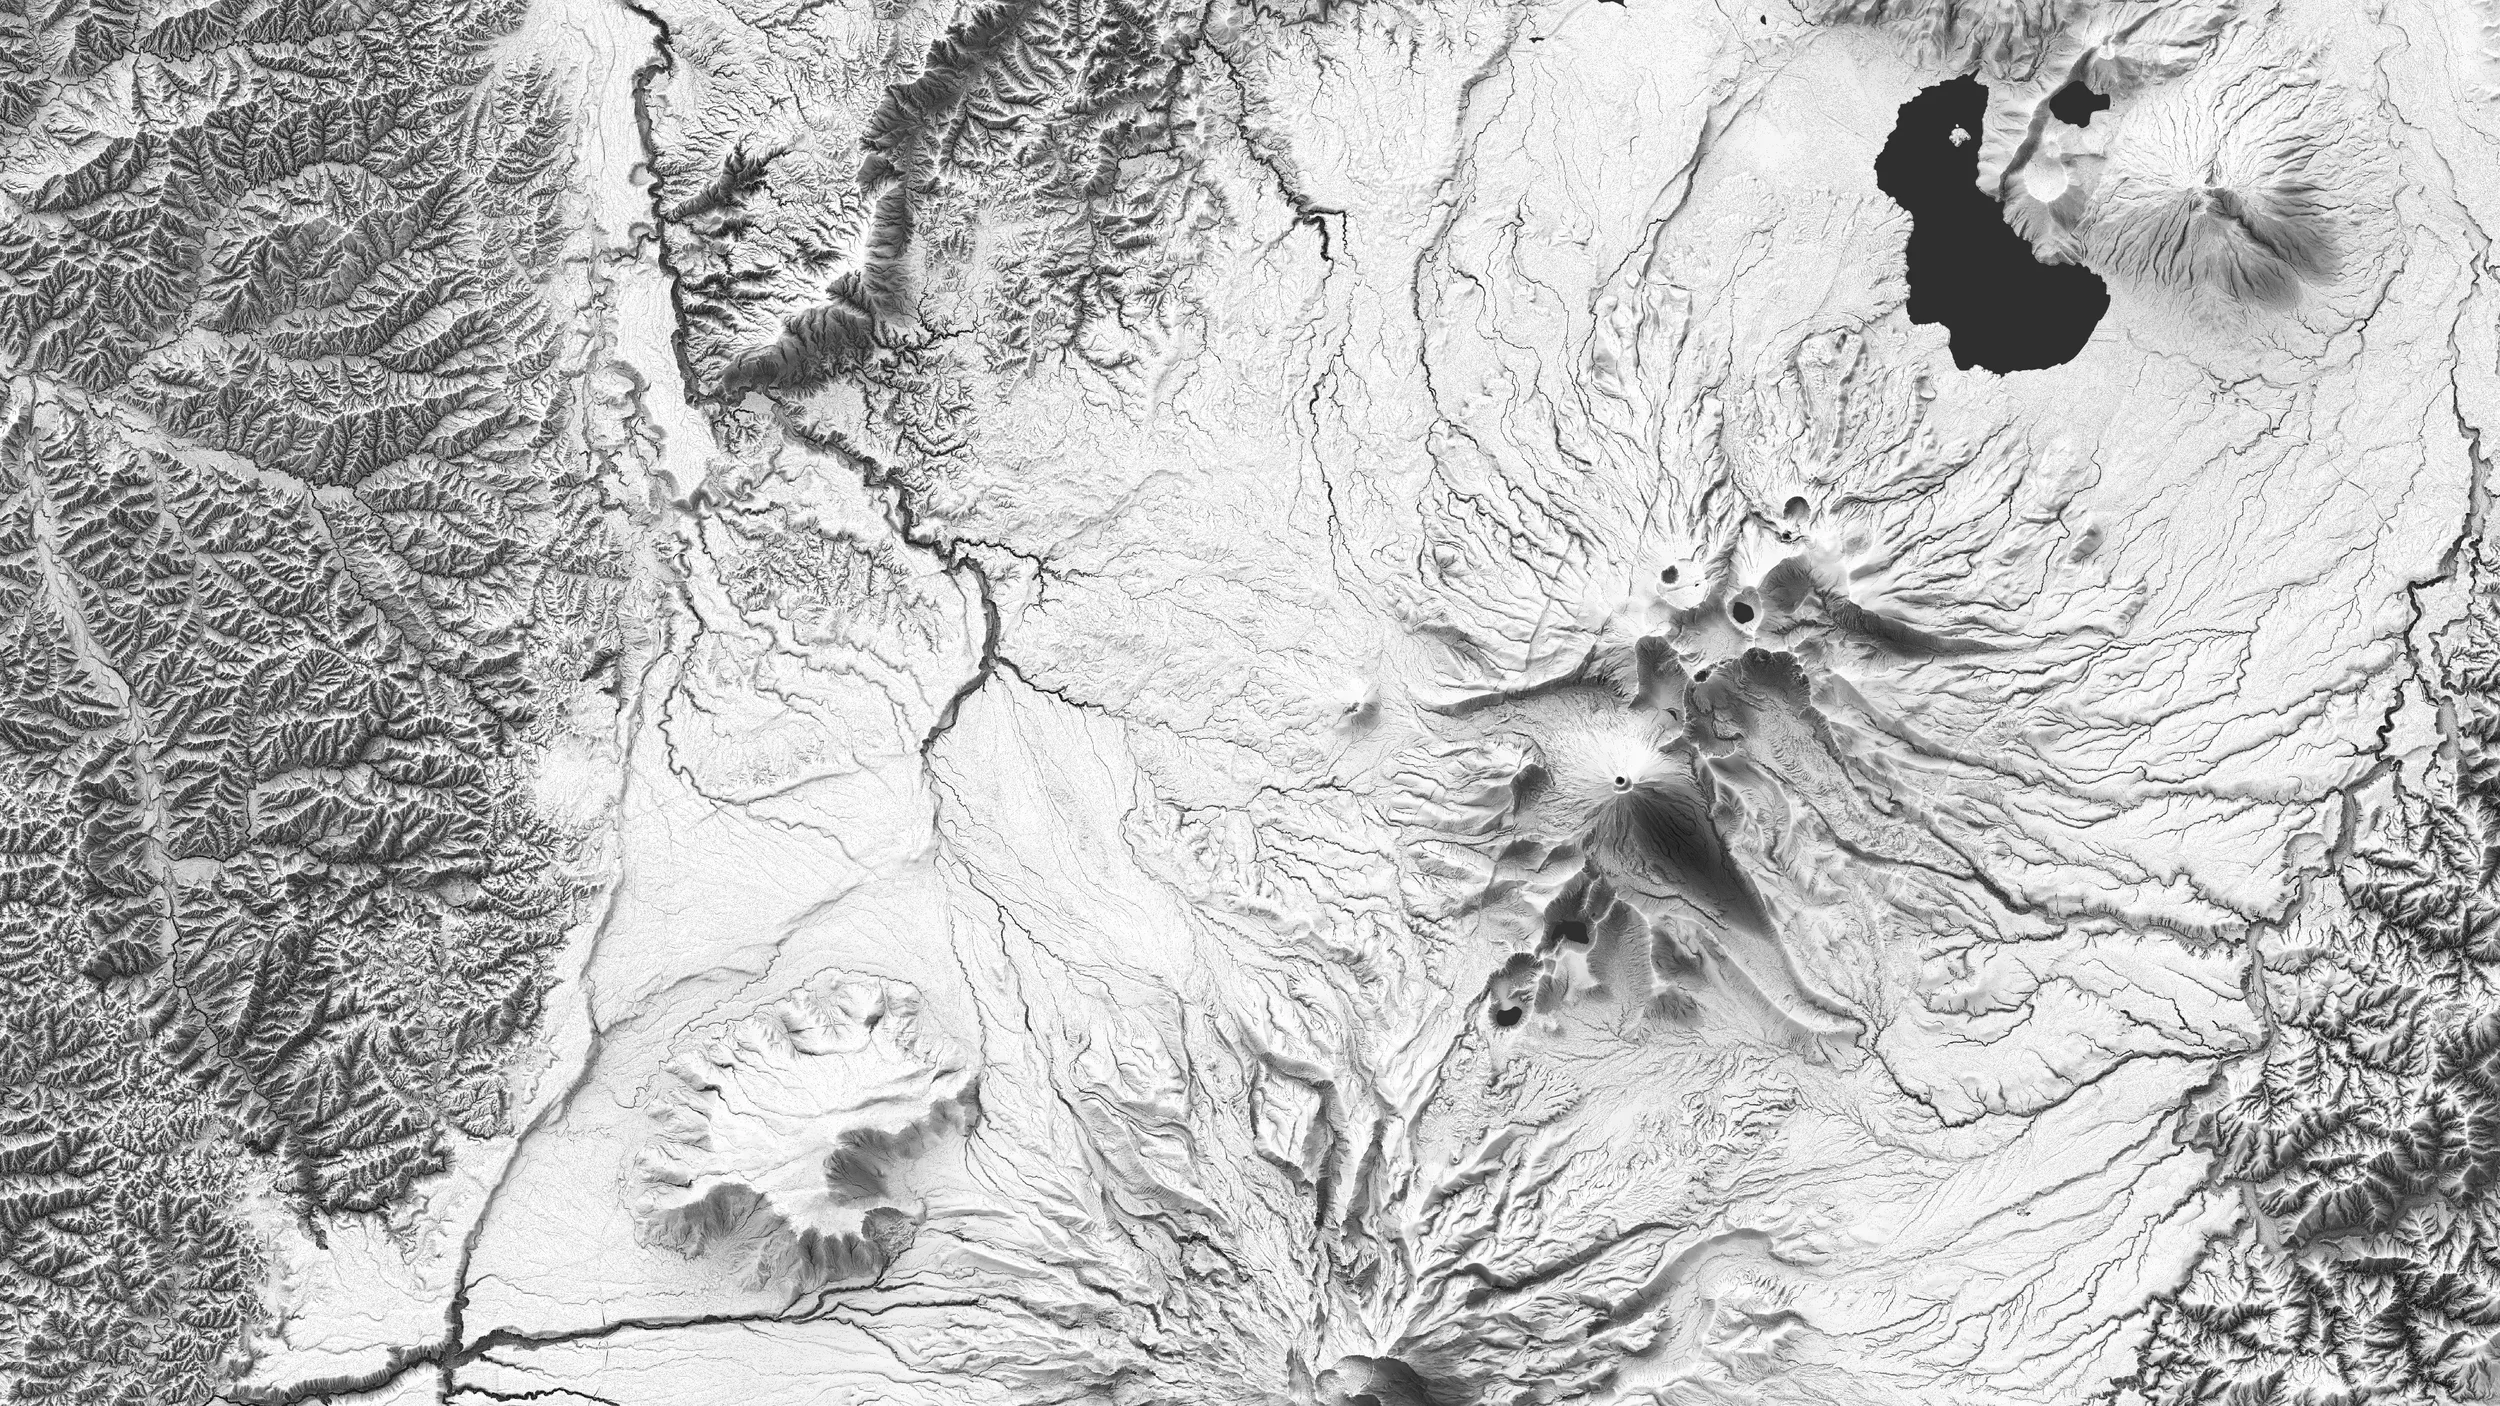
Miscellaneous Visualisations
Because the data extent I was working with was relatively large, here are some additional visualisations I was able to create in QGIS. The last four utilise additional data sources.
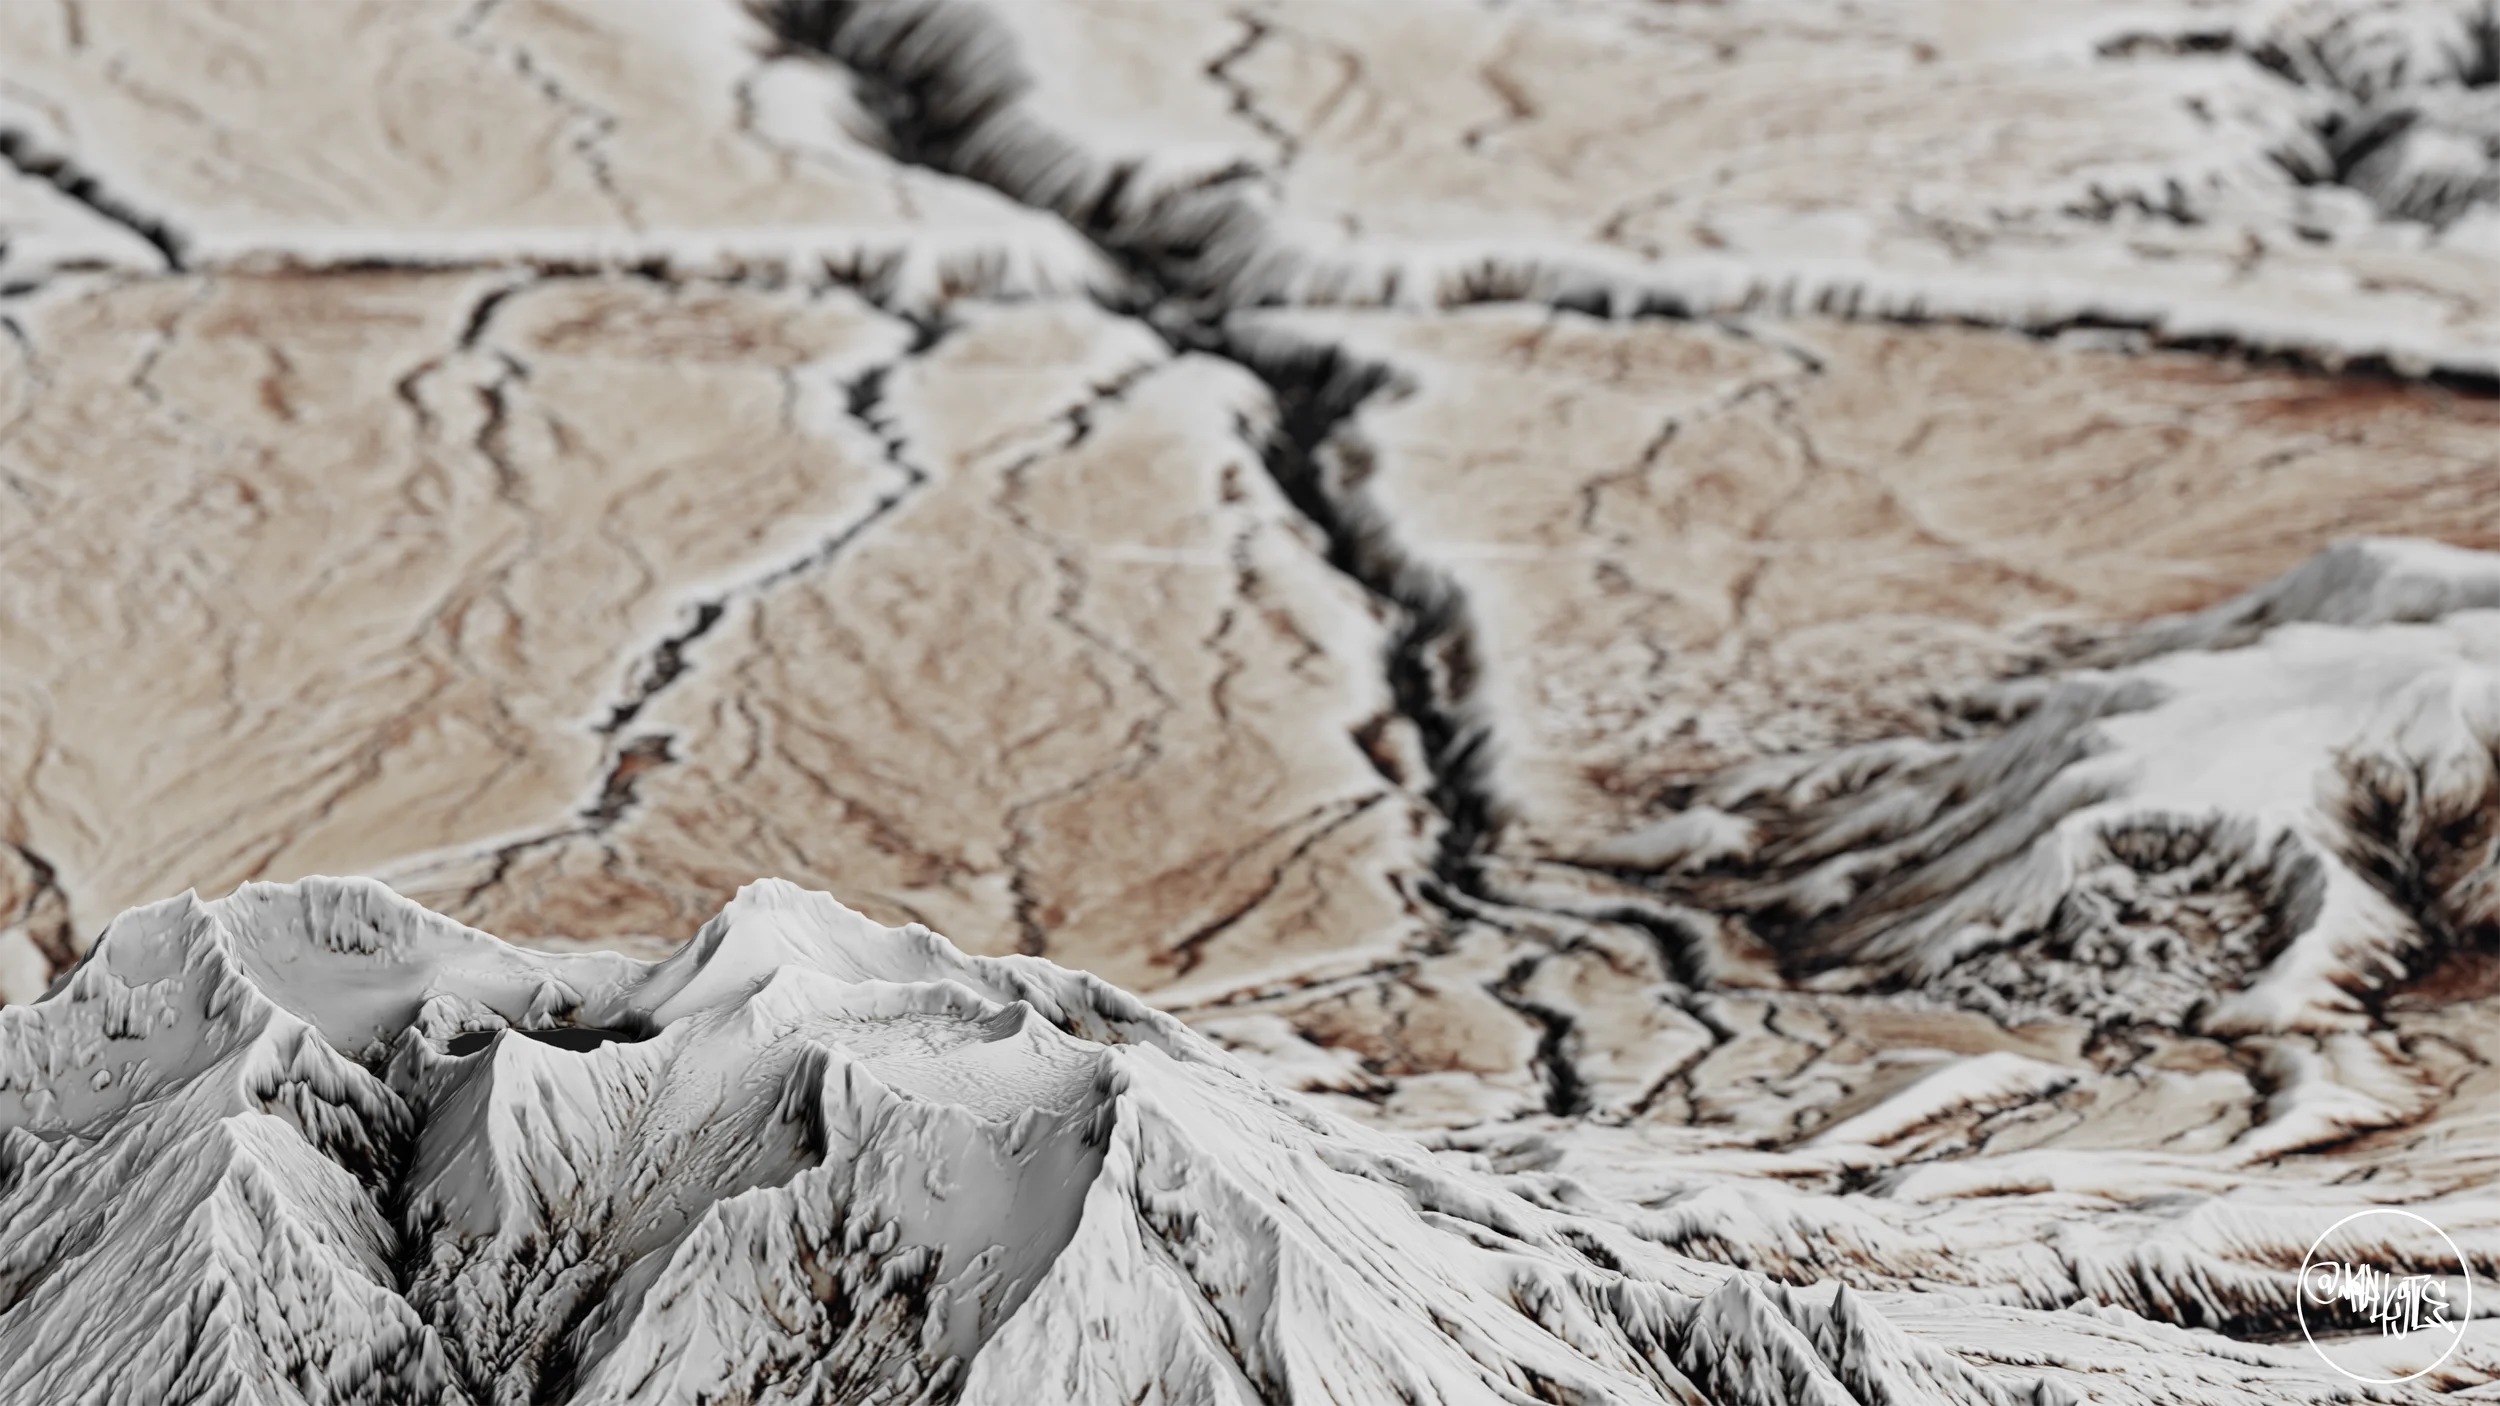
The Process
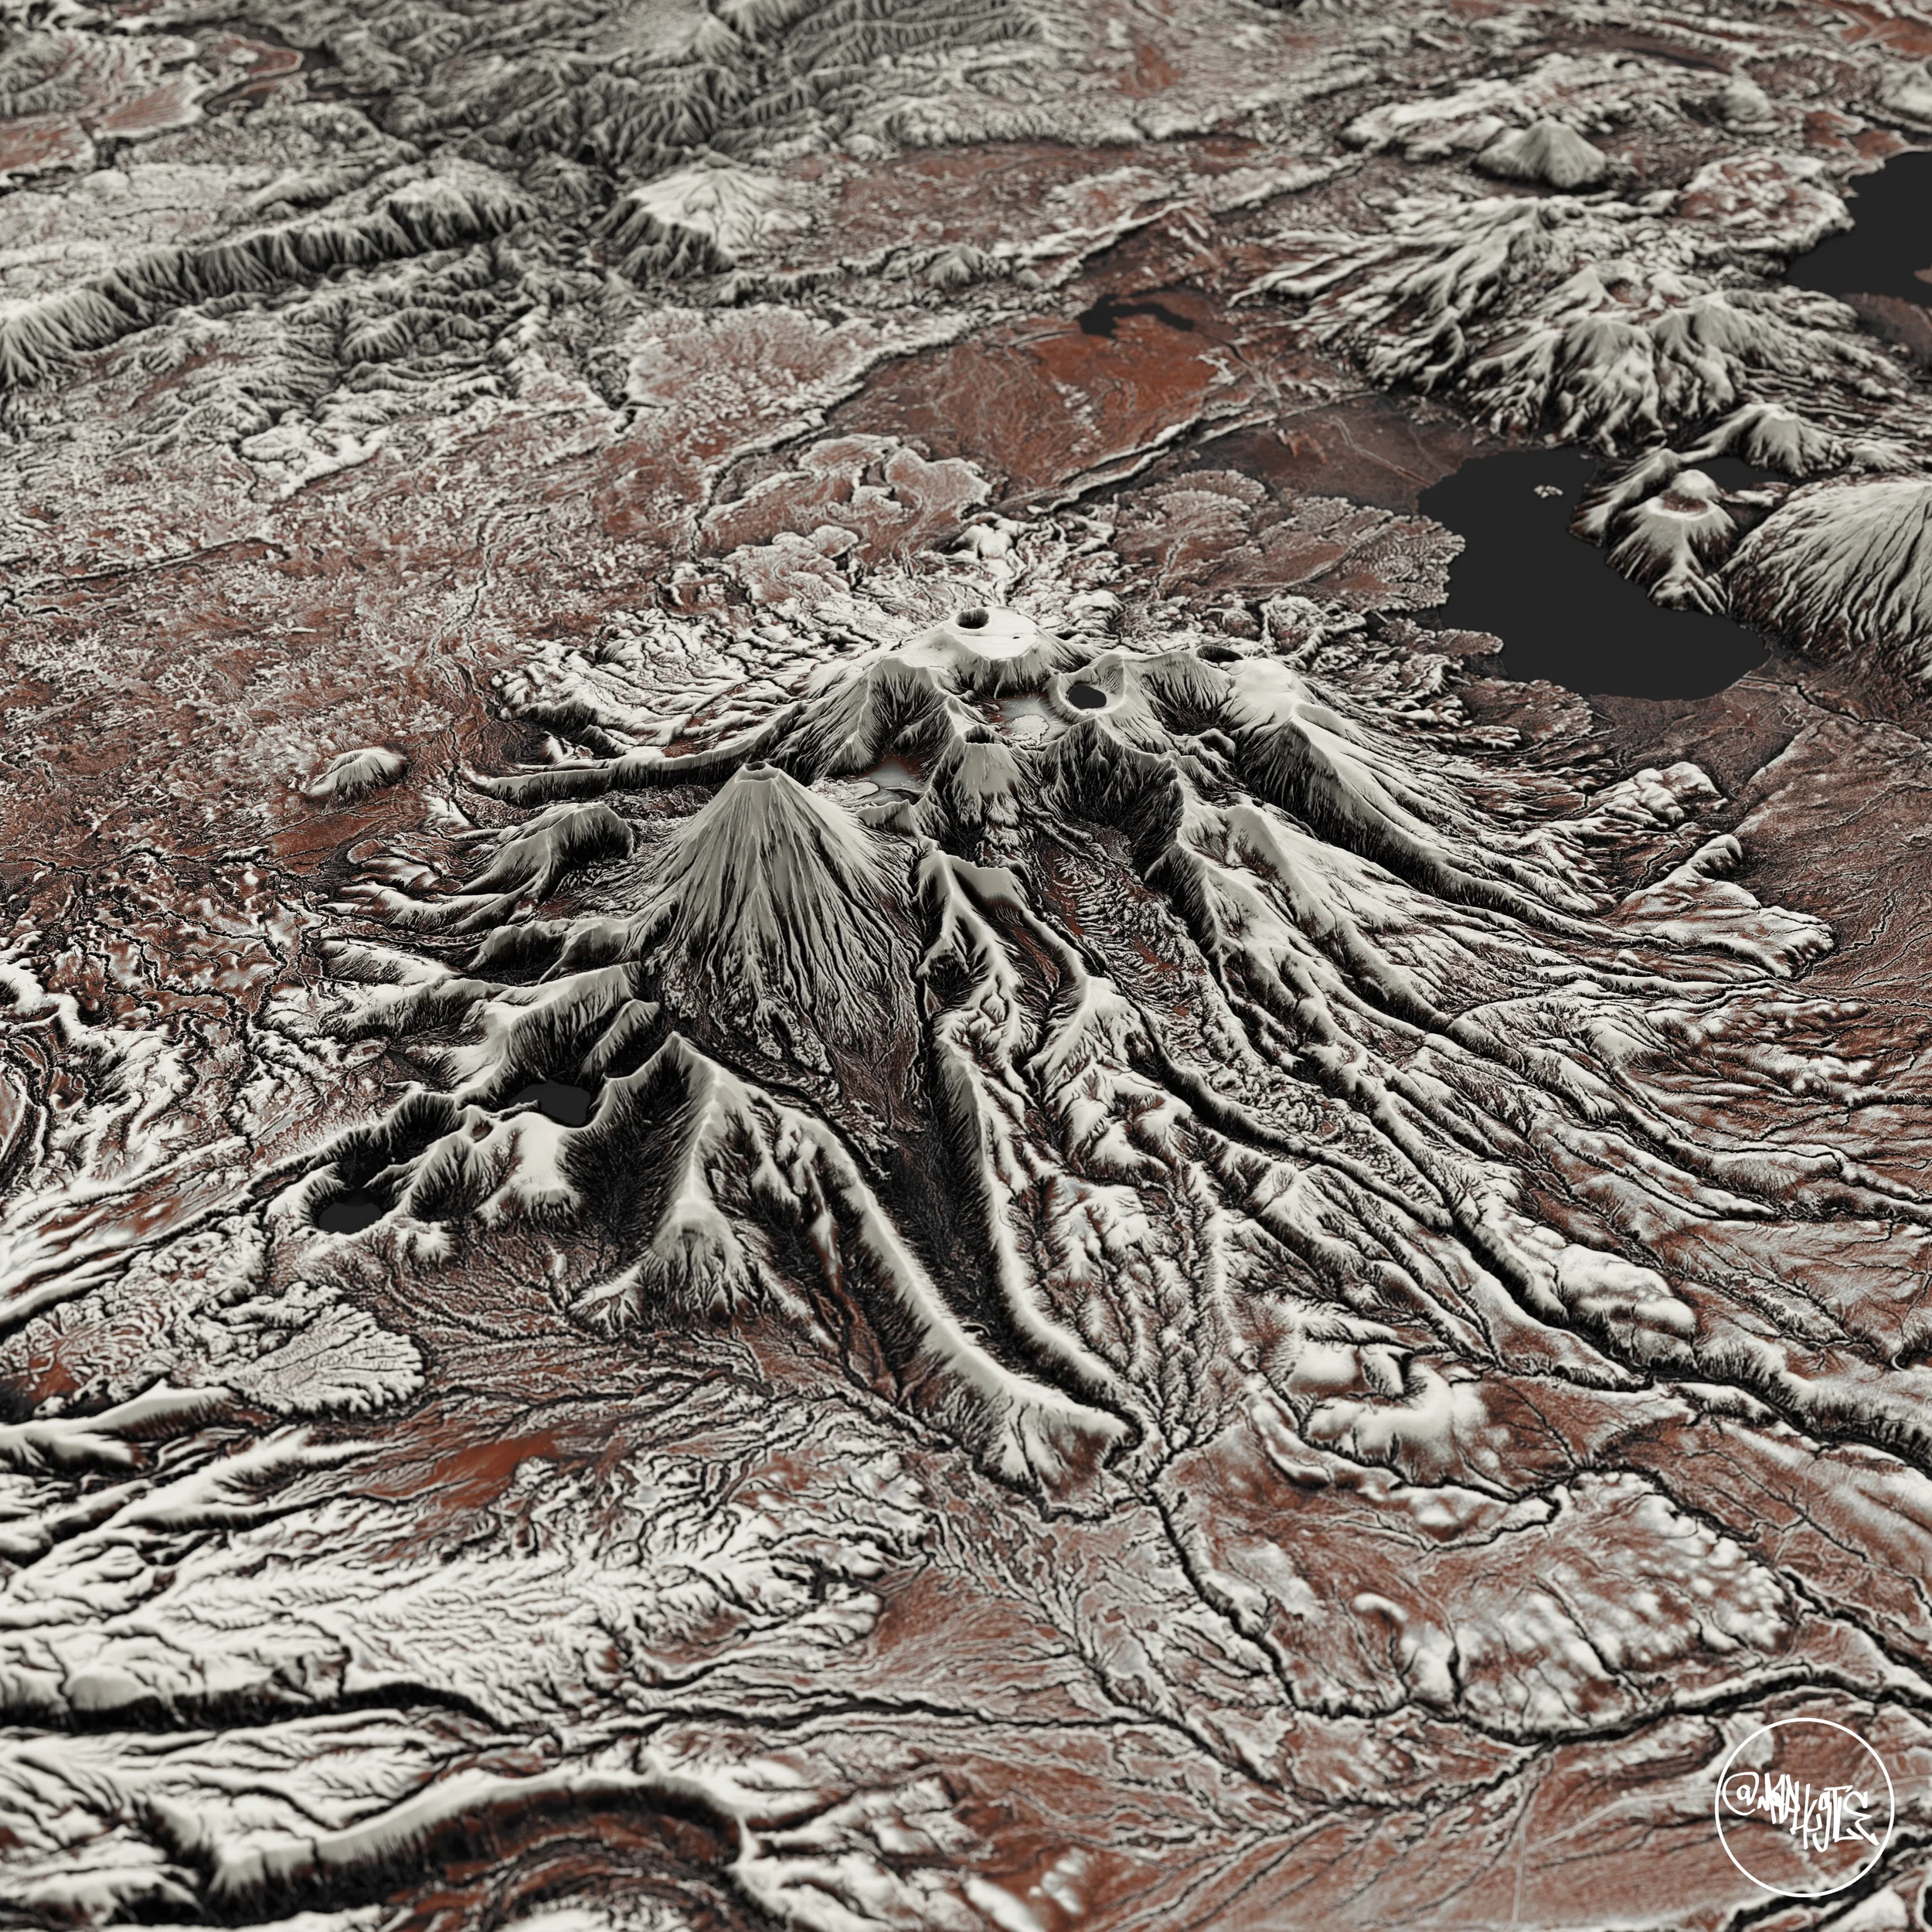
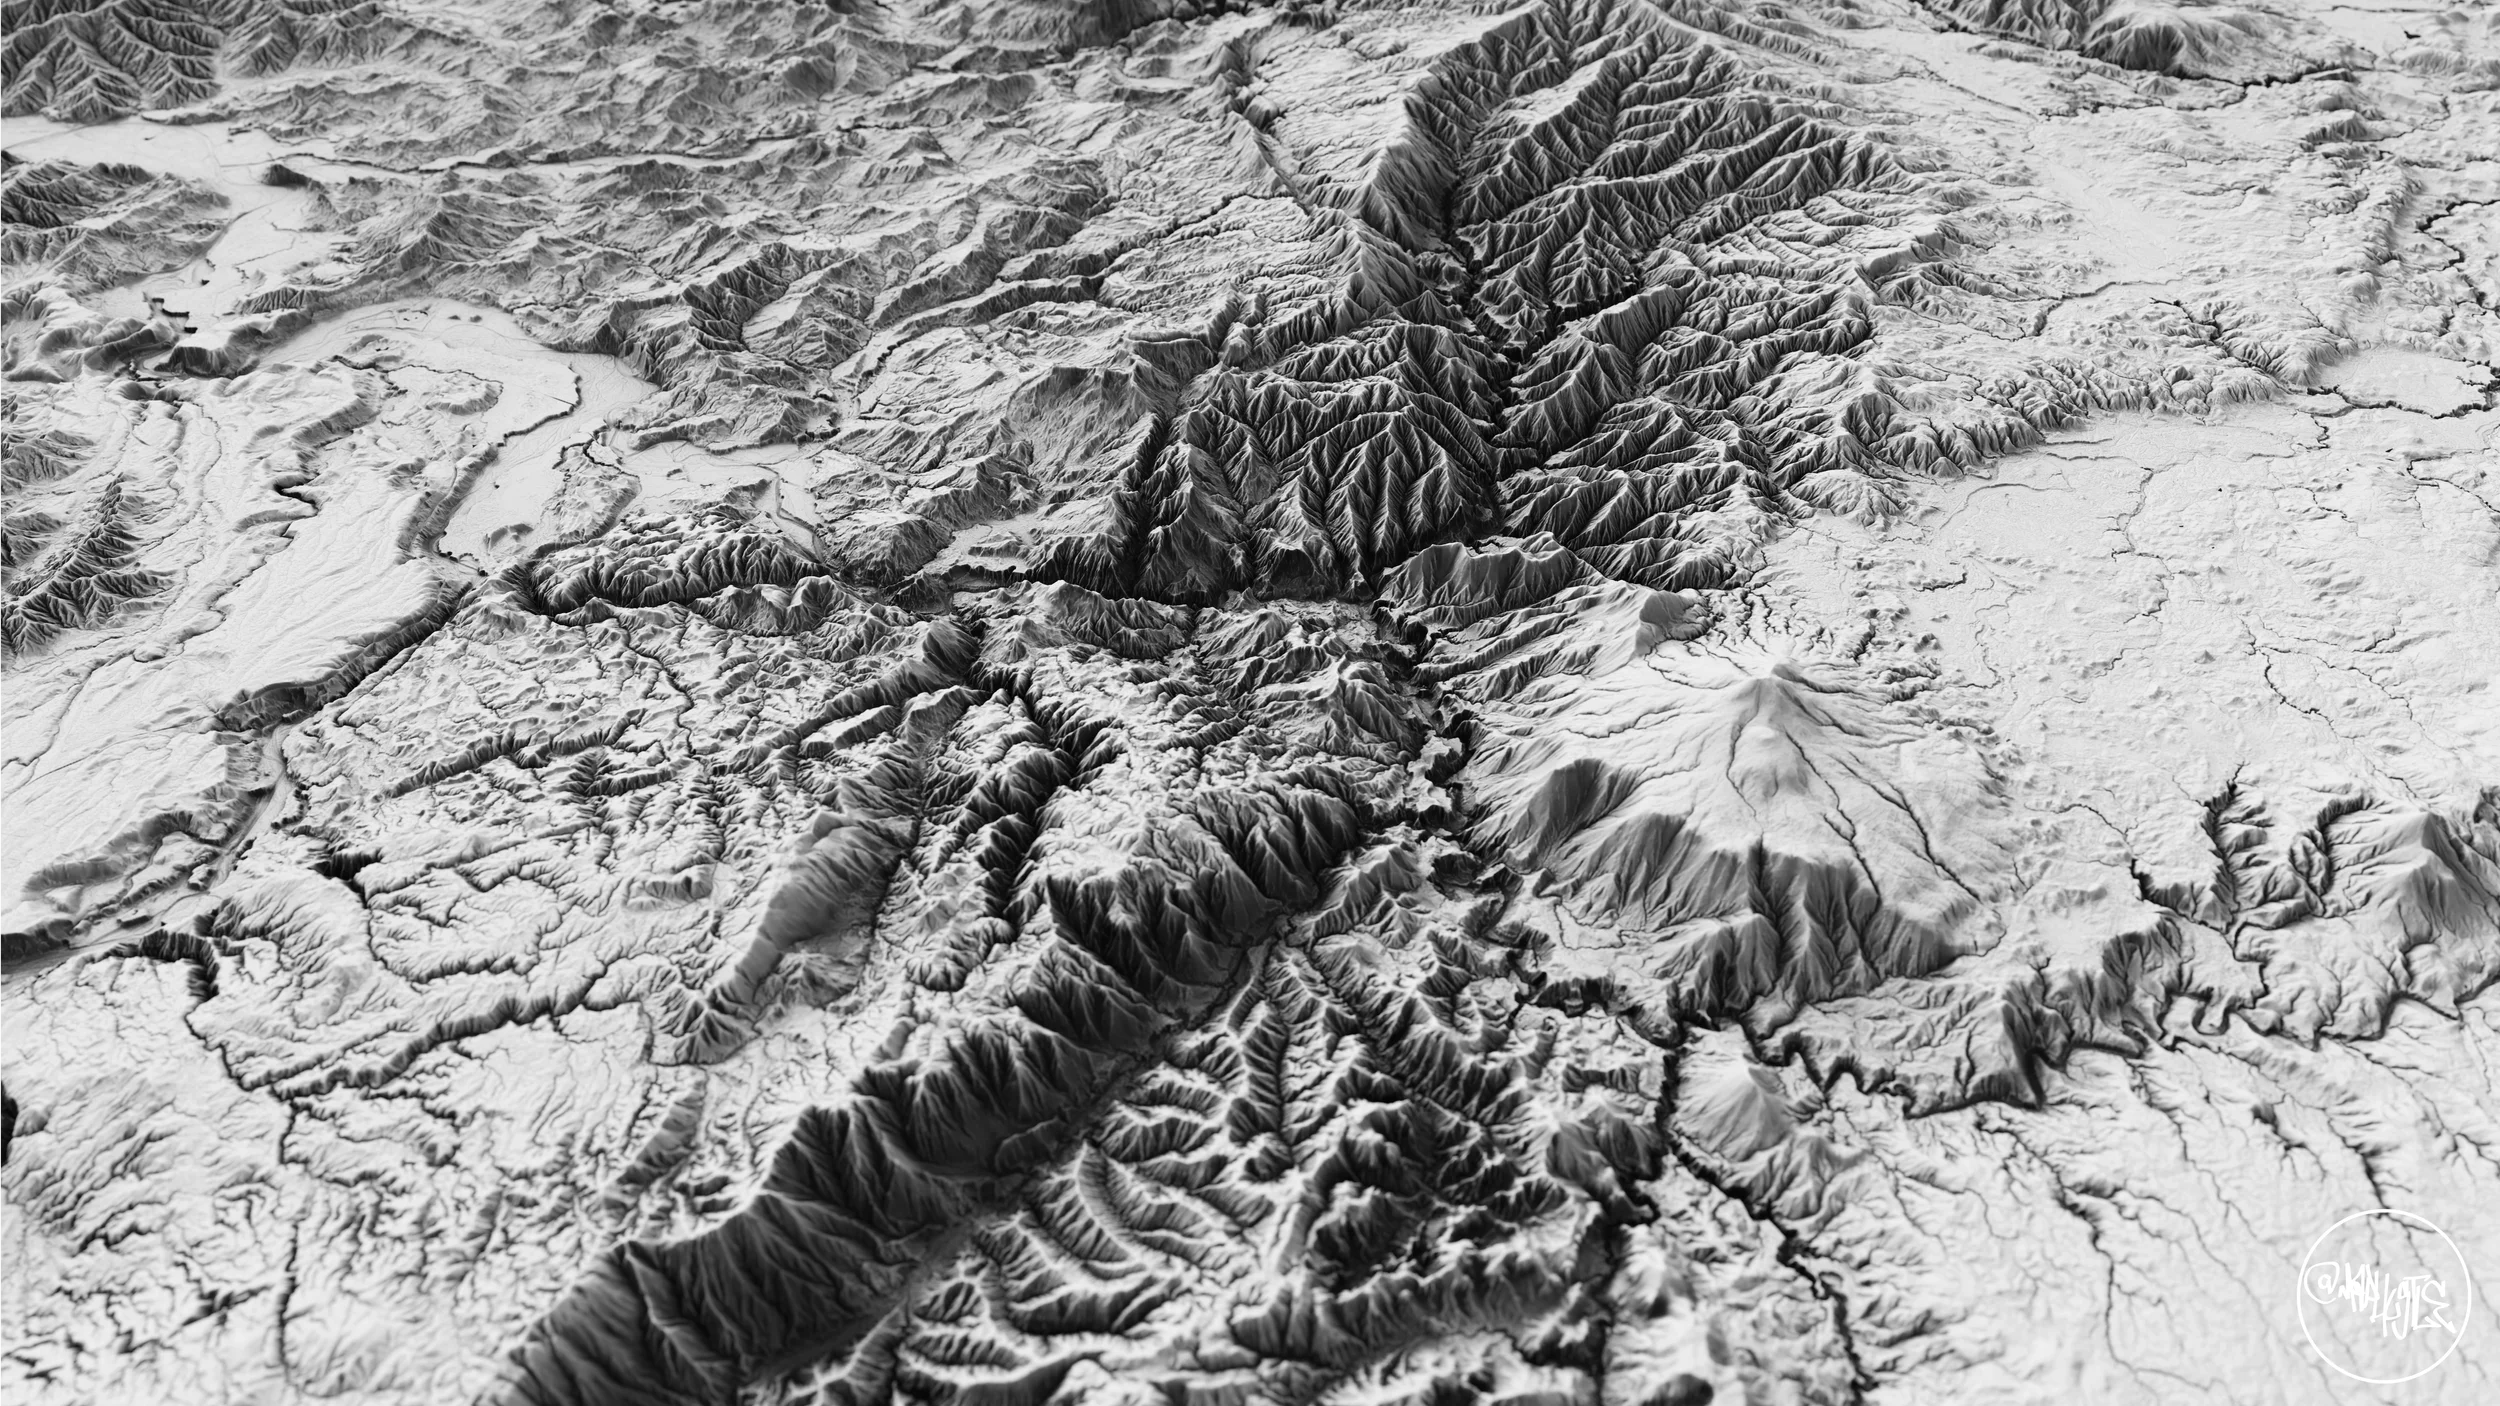
I’m showing here the detail I am able to extract from a Digital Elevation Model, in terms of relief shading generation and DEM manipulation. These images are an output from QGIS. For most projects, I aim to exclusively work in QGIS.
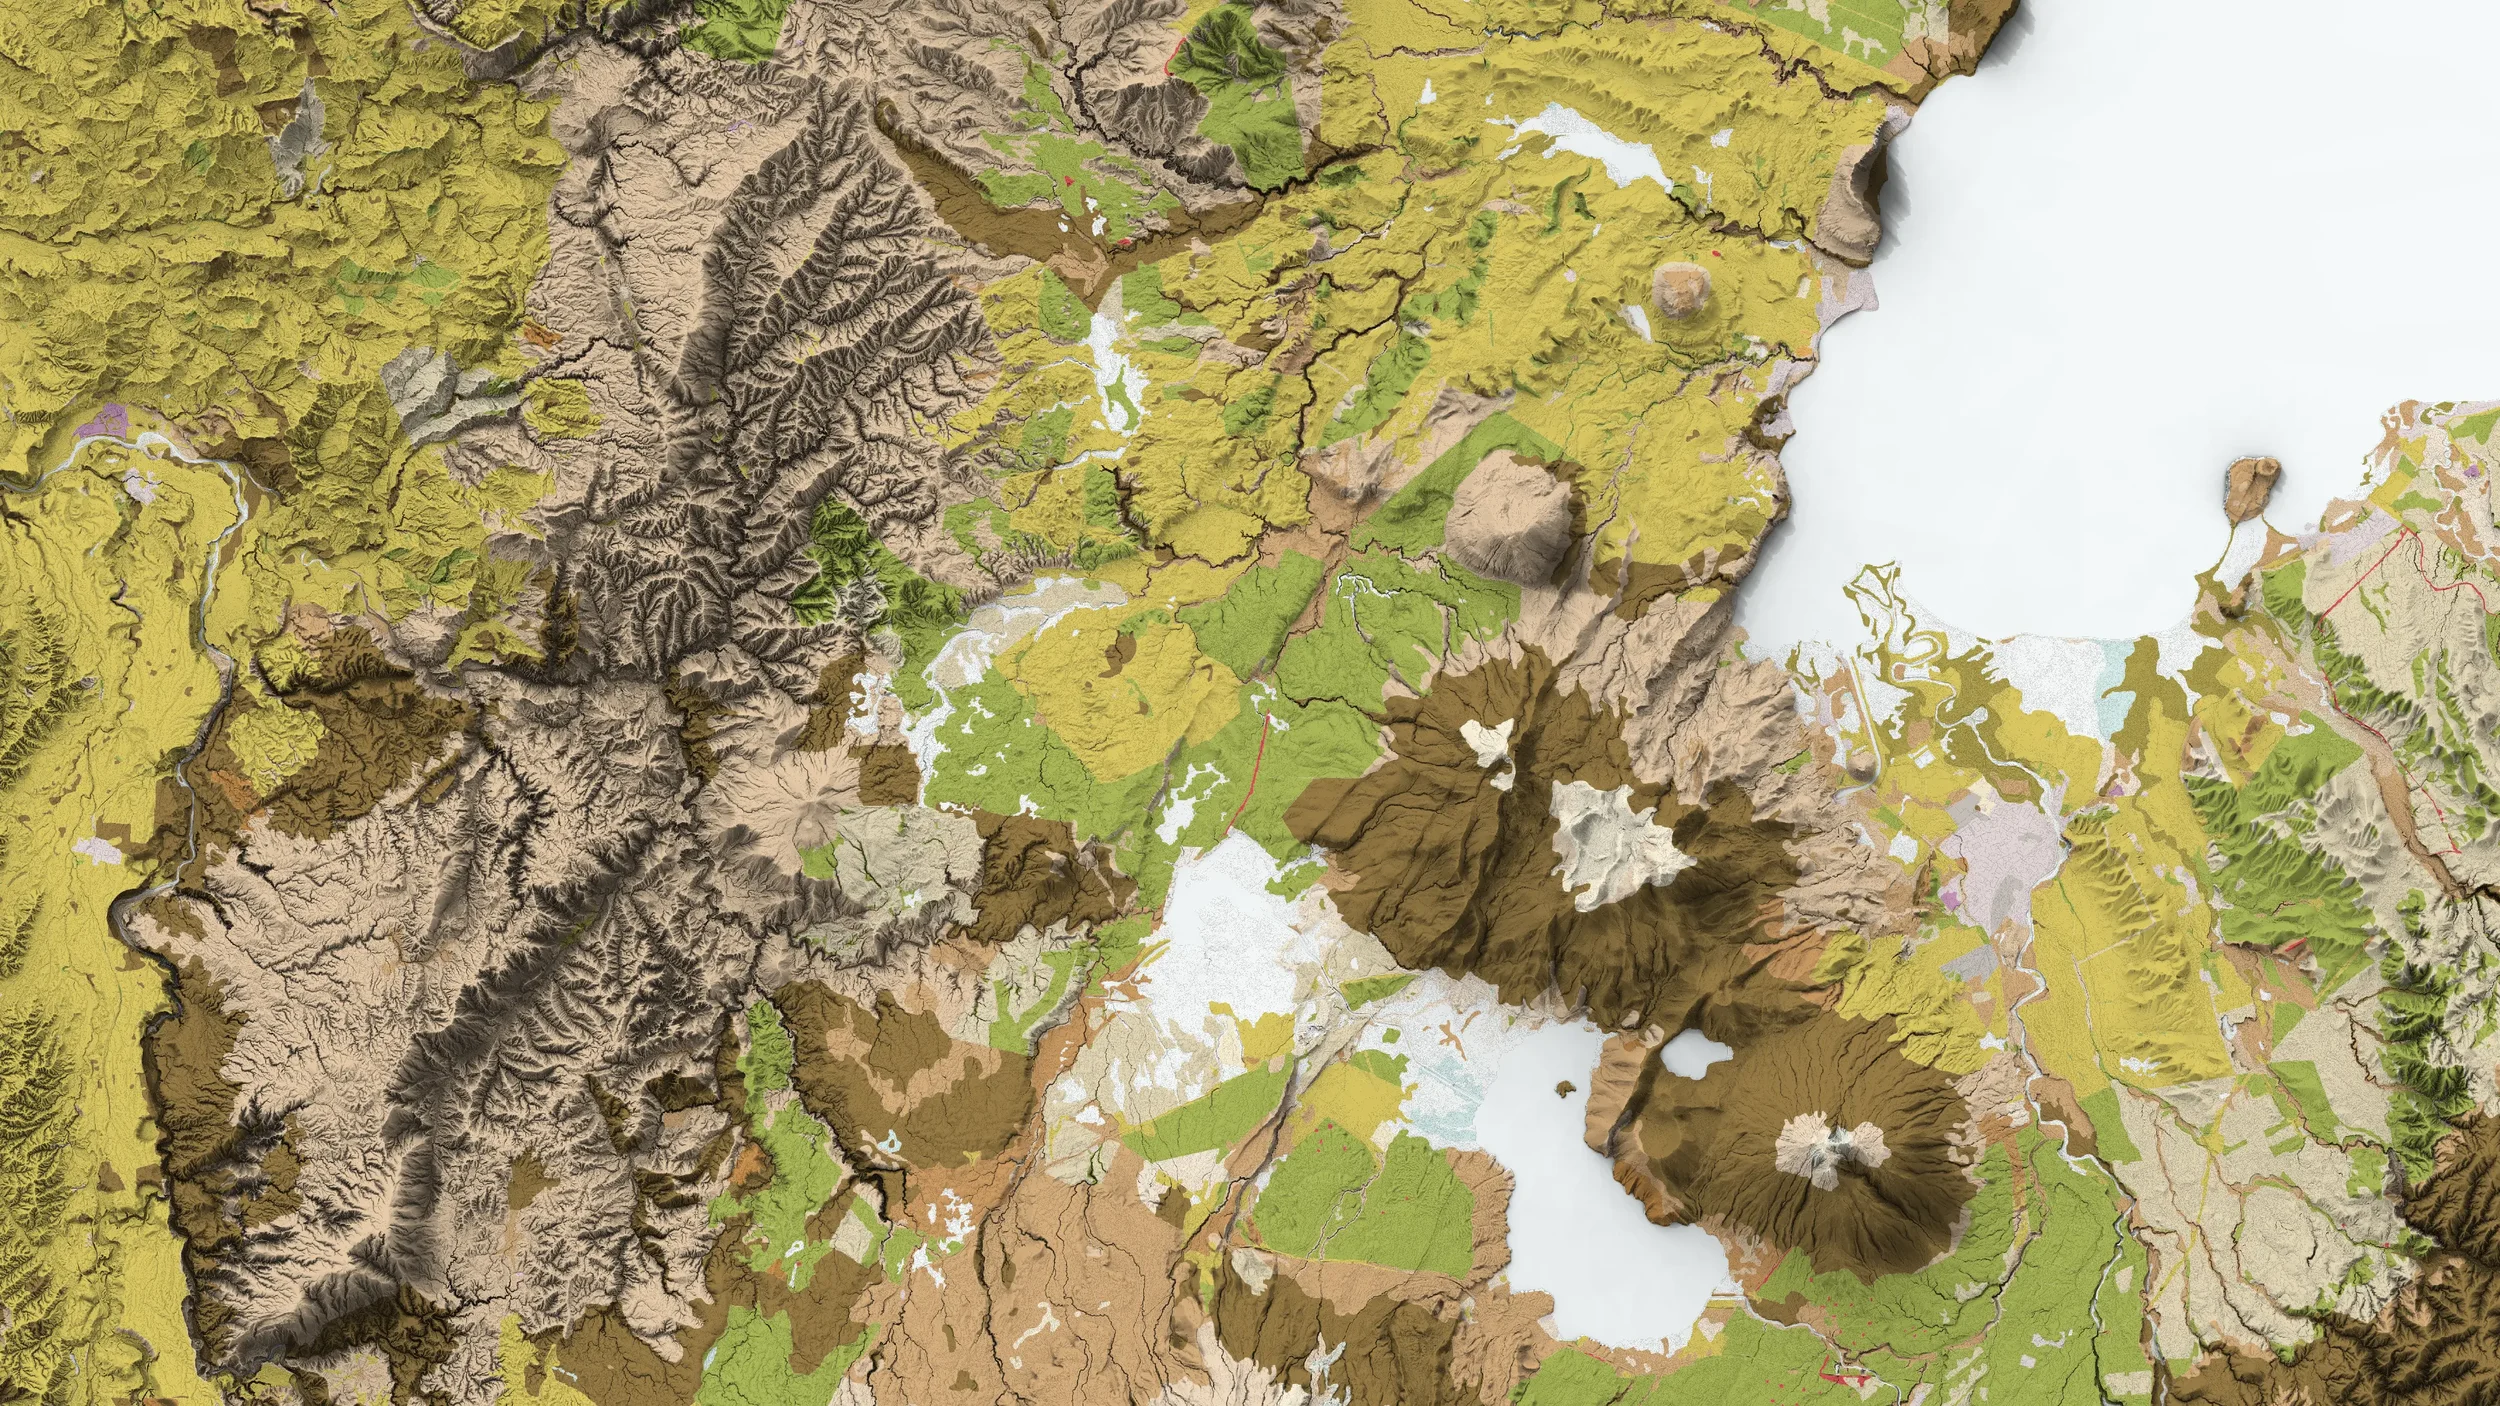
However, showing a scene in 3D is often more desirable. Using an image of the relief, in this case an output from QGIS, as a drape in a 3D modelling software, I can include some additional detail on the underlying model. In the examples below, this effect is intentionally subtle due to the lighting and shading choices, but it becomes more apparent once colour is applied.
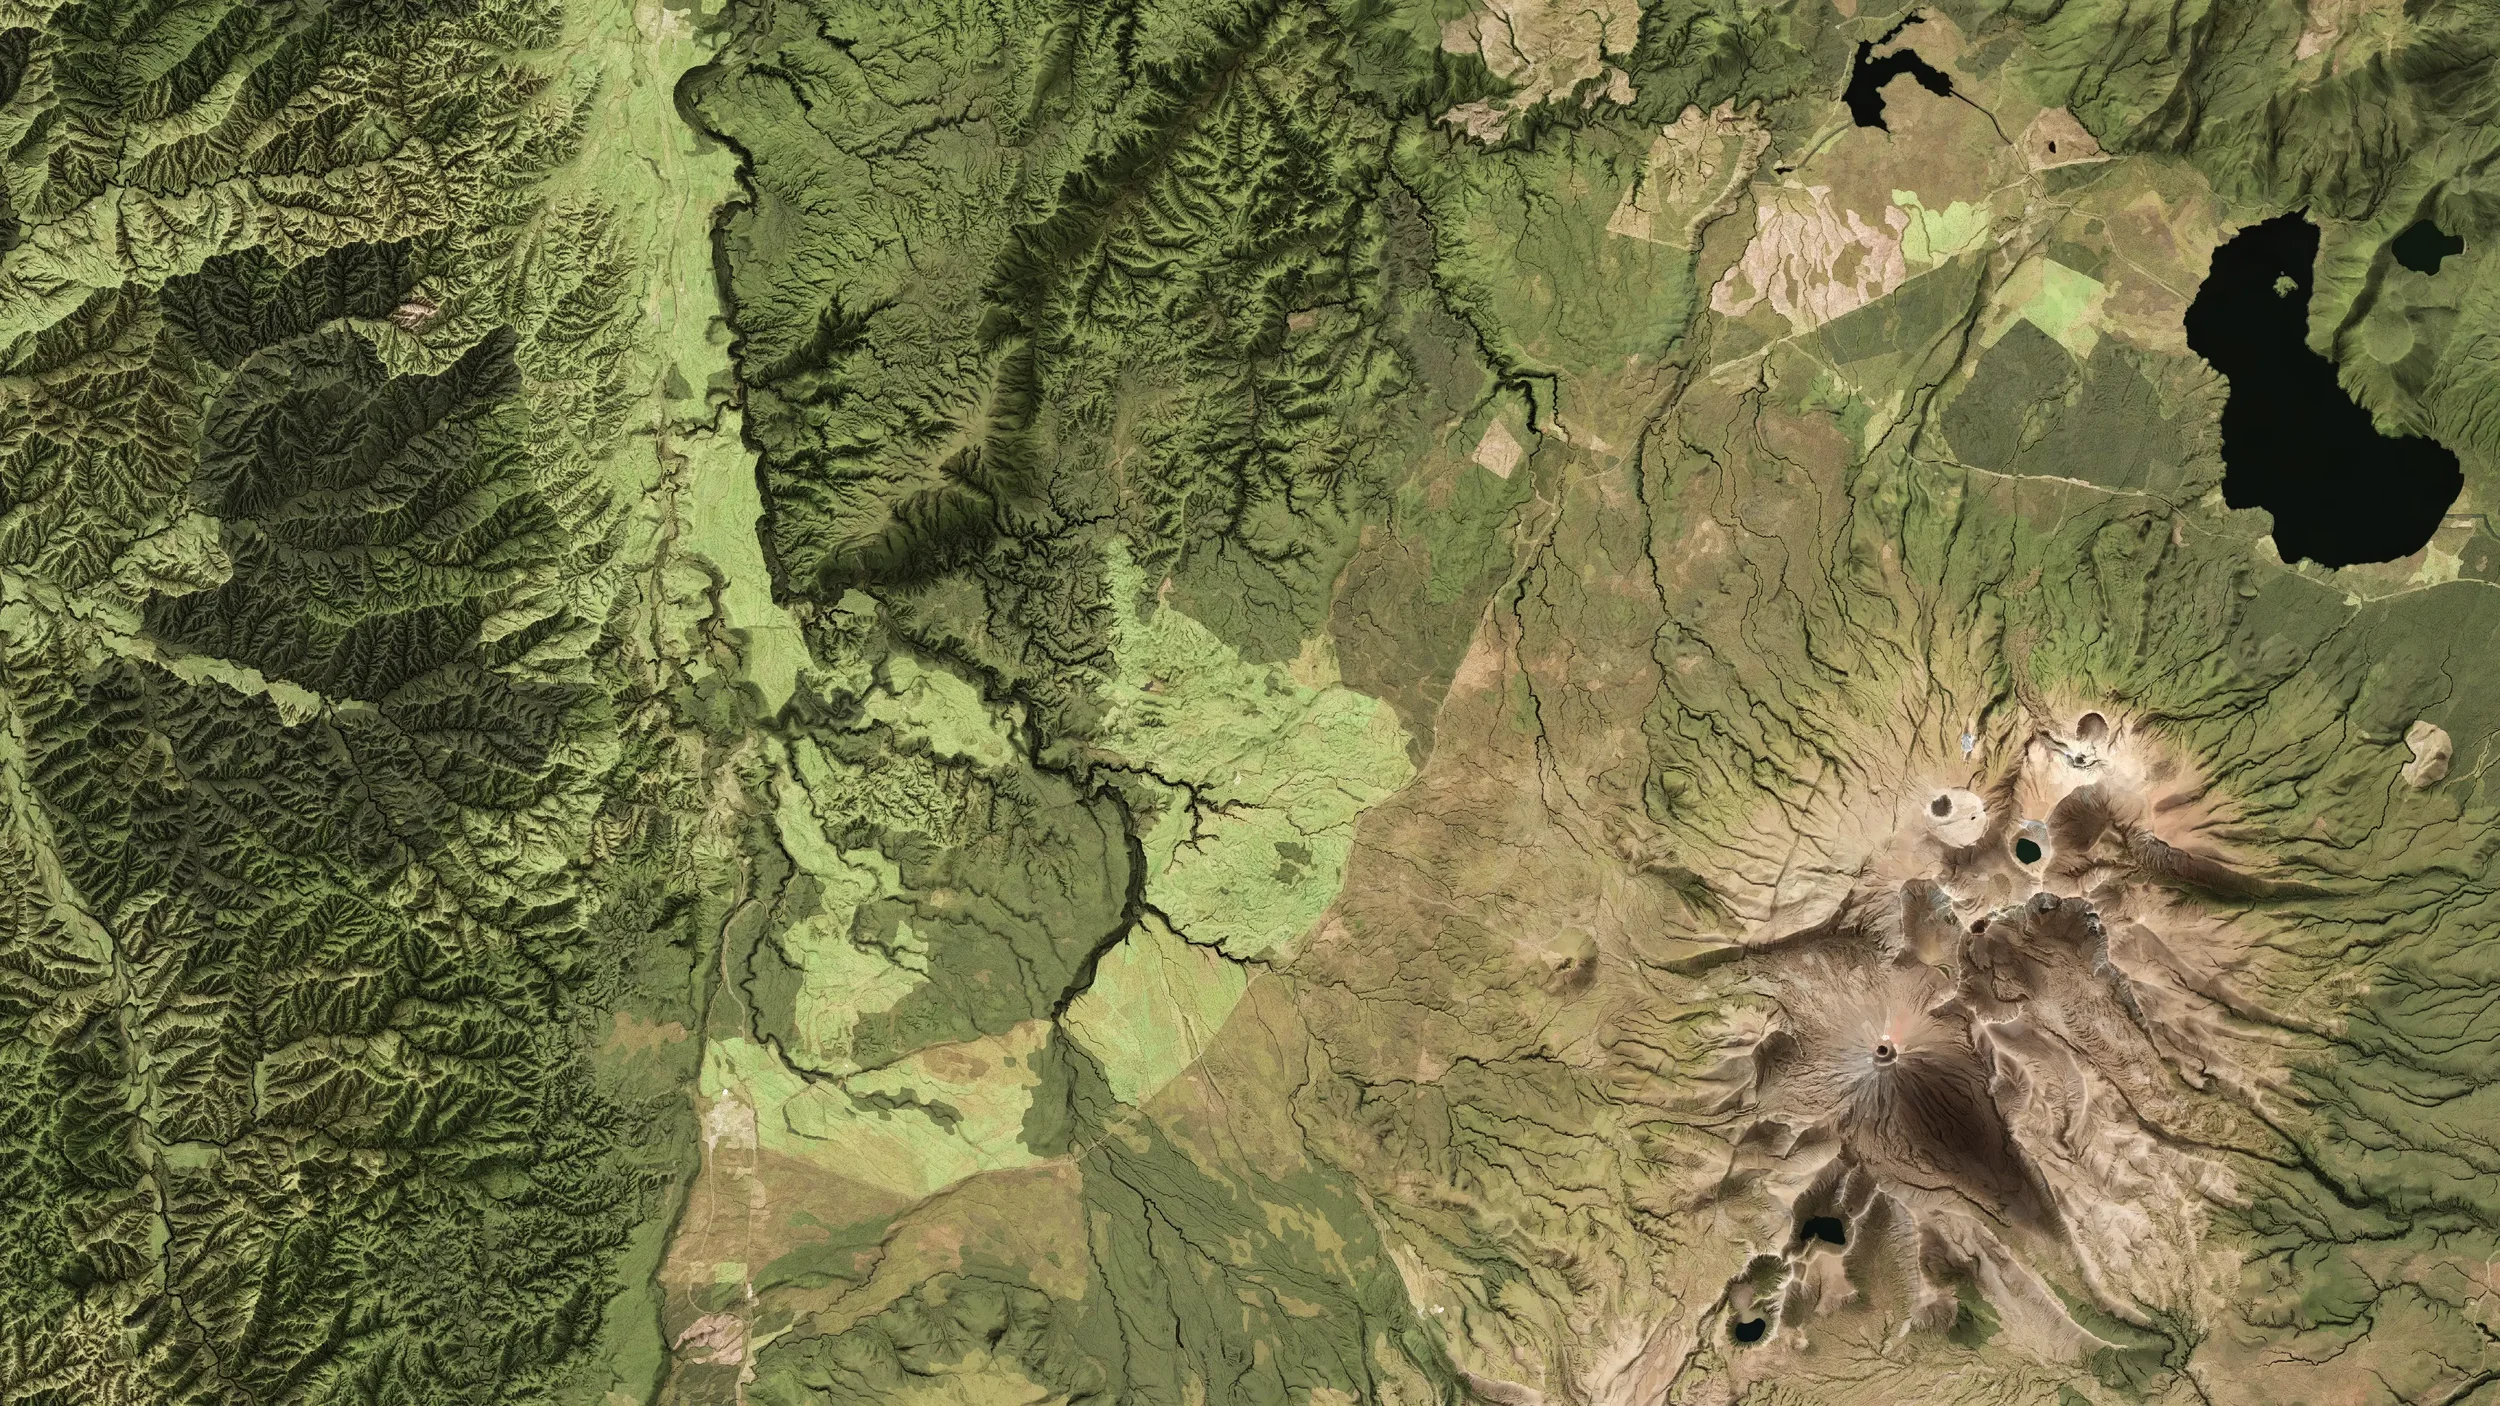
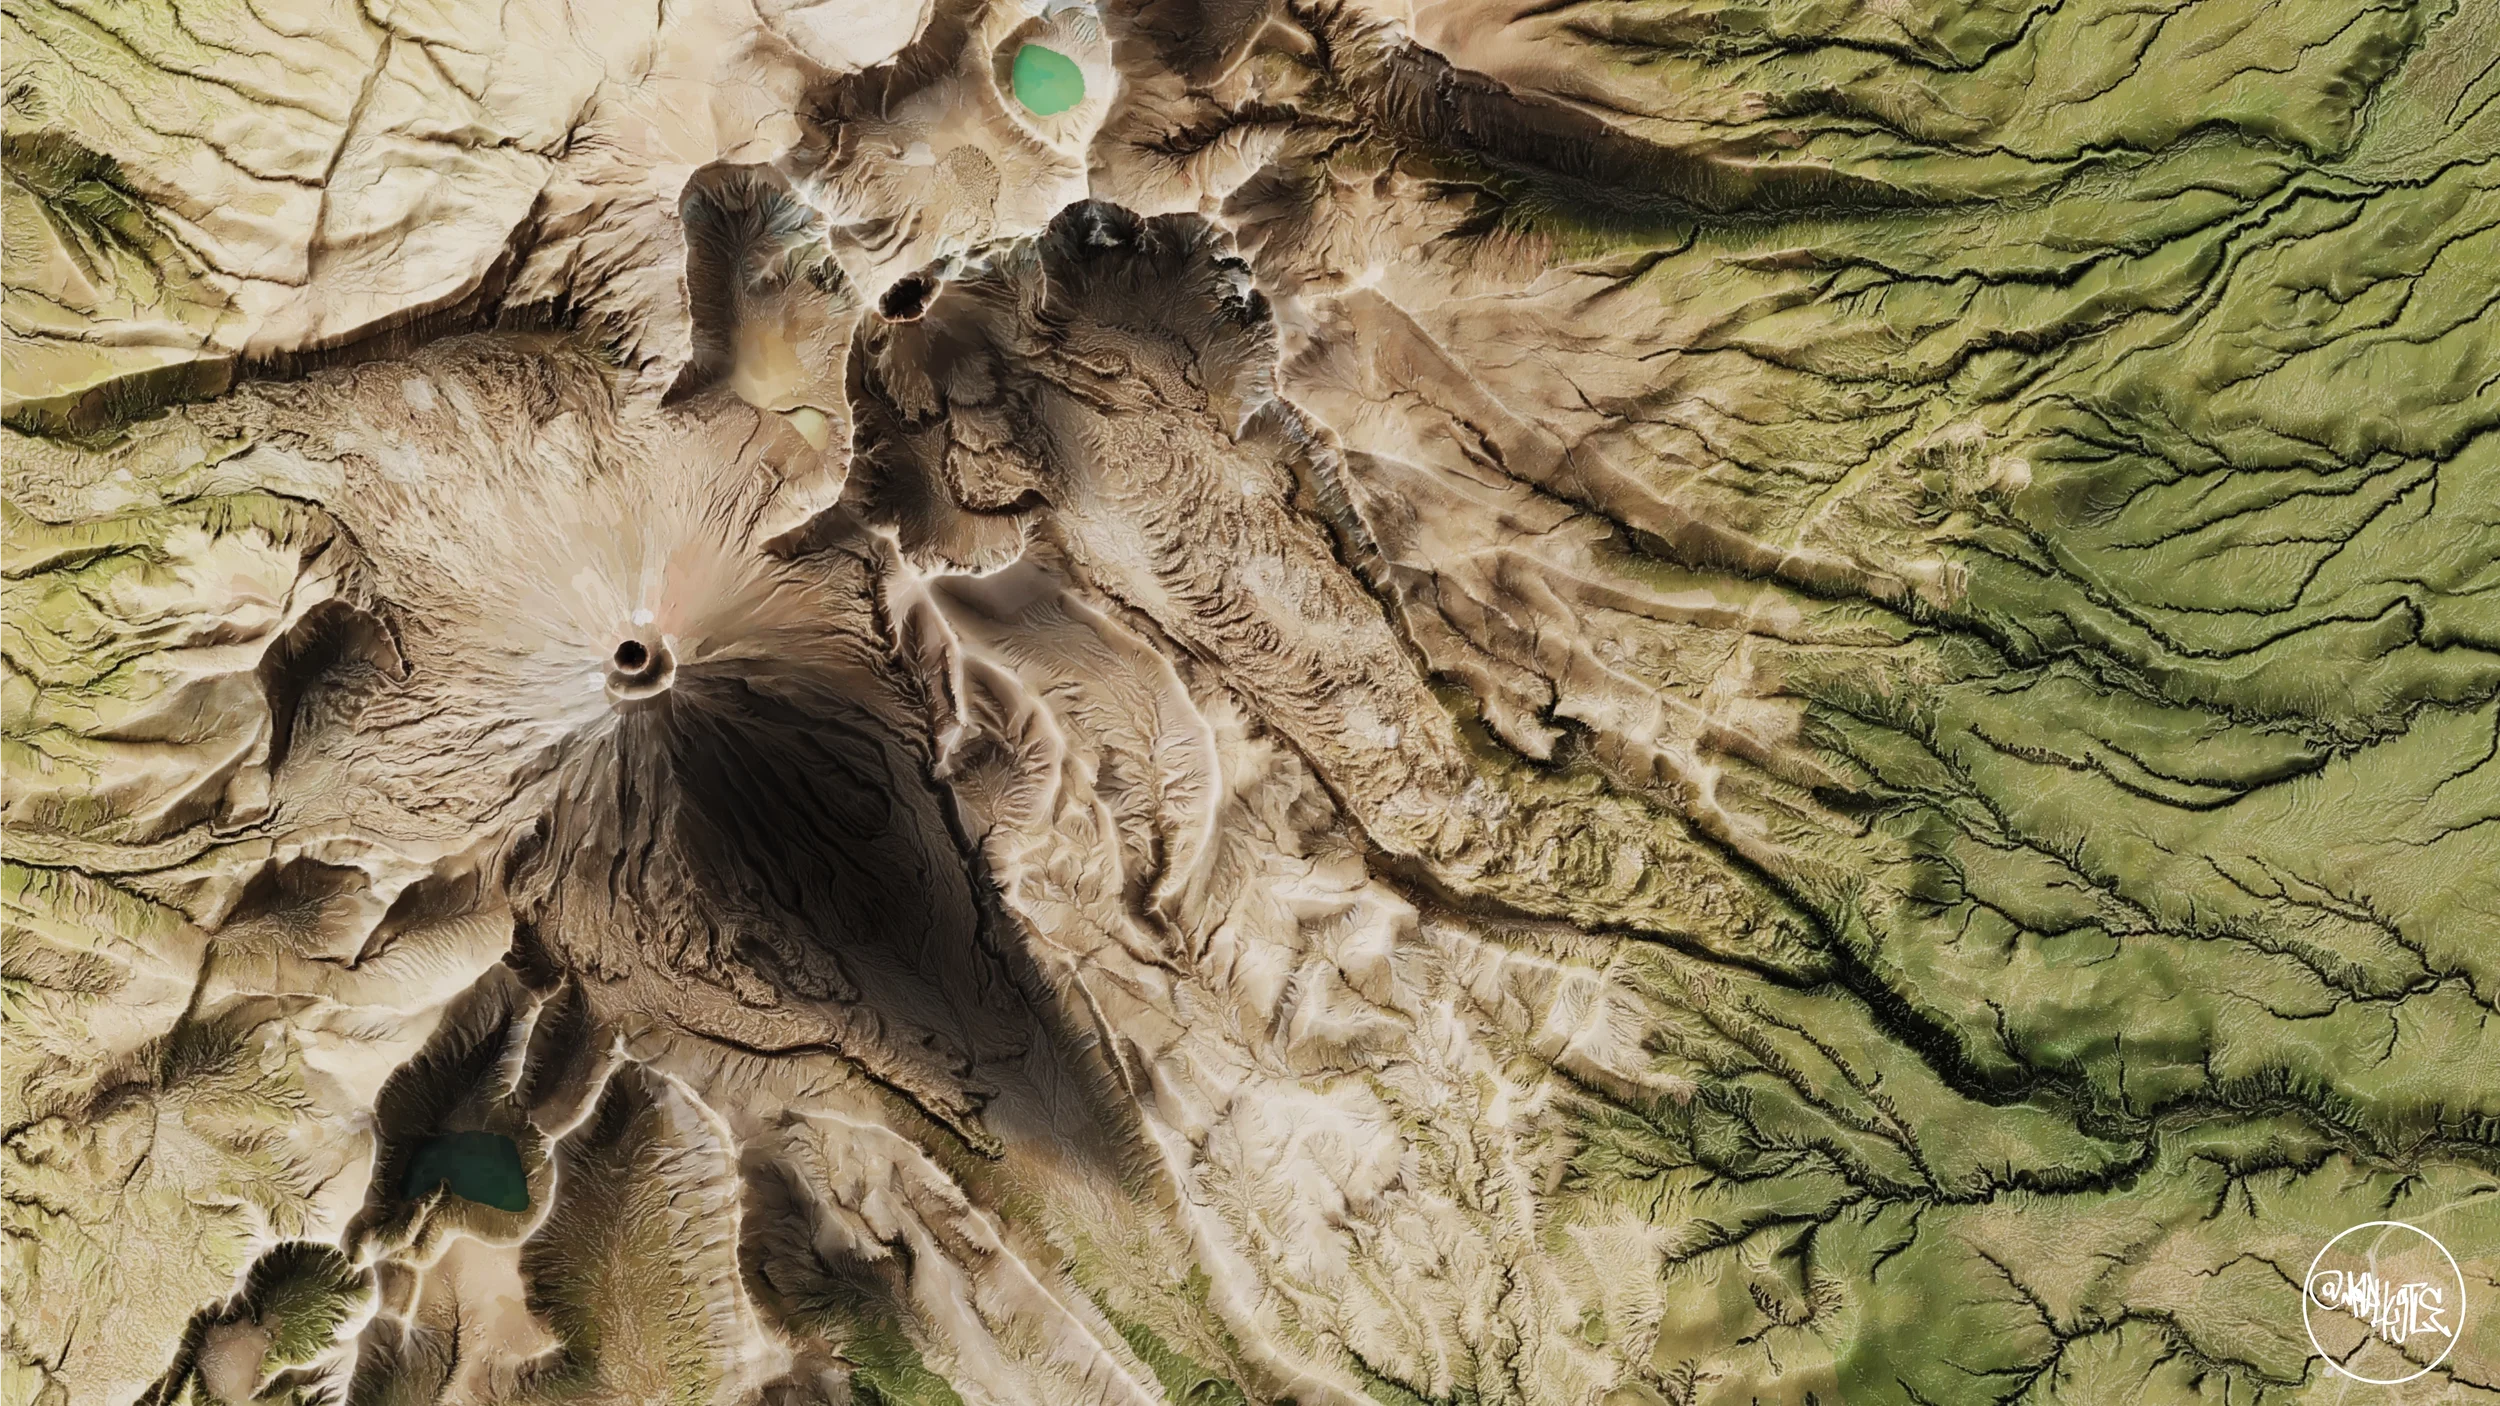
By combining with satellite imagery, the final result integrates contextual detail, an indication of the type of land cover, with the textural information derived from the DEM.
That is all for this blog! I hope you enjoyed looking at some images. Until the next one.
Data Attribution
Main datasets used
Waikato LiDAR 1m DEM (2021),
Manawatū-Whanganui - Whanganui River Catchment LiDAR 1m DEM (2025).
Sourced from the LINZ Data Service and licensed by Waikato Regional Council and Ngā Tāngata Tiaki o Whanganui, for re-use under the Creative Commons Attribution 4.0 International licence.".
Additional data, maps and references
LINZ CC BY 4.0,
Department of Conservation CC BY 4.0,
GNS Science CC BY 4.0, and
LRIS CC BY 4.0.